What's the argument here? Is anyone disputing that the 10 feet figure isn't the
maximum value from the California Commission report?
Yes. Longview did.
I say it's not a realistic maximum estimation as it comes to an average rate of
over 37 mm/yr for the next 82 years. And that's just plain silly.
And that's what, based on your years of education and study in climate science? Years working in the field, perhaps? Extensive expertise running climate change models?
Because it
kinda seems like you're looking at the conclusions, and not bothering to read how they arrived at those conclusions and what those conclusions mean, and objecting anyway.
Even the CU Sea Level Research Group's recently rewritten historical sea level
data doesn't support the 10 foot sillyness...
Again!
Global rise will not be the same as rise in specific locations. Due to numerous local variations, some areas will be higher than the global average, others will be lower. That's... how averages work.
There just isn't a mechanism for the extra 8 feet....
There certainly are "mechanisms" for much faster rise, namely substantial losses of ice in Greenland and the Antarctic. CU isn't necessarily talking about them, because they are specifically talking about
one scenario, where sea level rise continues to accelerate at the current pace (0.084 per year). This seems to be close to one of the mildest scenarios.
Other organizations are talking about scenarios where sea level rise accelerates much faster. The maximum is RCP 8.5, which is (as described above) "business as usual" with high population growth, minimal gains in energy efficiency, heavy reliance on fossil fuels and so on. I.e. much of the critical variability here is in
what humans do, and how much GHGs we emit over the next 50-80 years.

And again: GMSL is a global average, and doesn't tell you how much tide levels will rise in specific areas (and, really, vice versa; using tidal gauges to measure global sea level rise requires tons of adjustment.) GMSL is an
average, which means that in the worst case scenario some areas will see far more than 6 feet, others will see less.
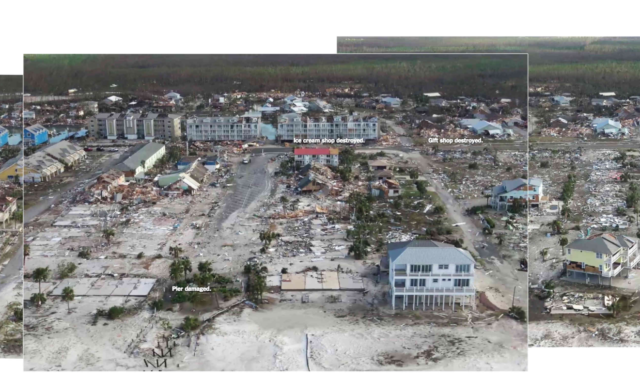
By the way, the California guide is saying "if you want to prepare for the worst, prepare for 10 feet by 2100."
And just to drive the point home, this is what can happen when you prepare for the worst, and your neighbors do not. They get flattened, and your home survives.
And
yet again! You brought this up to criticize Scientific American. However, the simple fact is that
Scientific American accurately reported the findings. The fact that you dislike the findings, based on your own preferences rather than actually reading the science, does not mean that SciAm got anything wrong.