• This is a political forum that is non-biased/non-partisan and treats every person's position on topics equally. This debate forum is not aligned to any political party. In today's politics, many ideas are split between and even within all the political parties. Often we find ourselves agreeing on one platform but some topics break our mold. We are here to discuss them in a civil political debate. If this is your first visit to our political forums, be sure to check out the RULES. Registering for debate politics is necessary before posting. Register today to participate - it's free!

Climate Alarmists Caught Faking Sea Level Rise

Thanks for posting that. When I click on a link to a Scientific American article this
terse little message comes up:

You have 0 complimentary articles remaining.​
I'm not sending Scientific American money for the privilege of reading their crap.

Yes there are people out there who must never look at the tide gauge record,
really believe ten feet of sea level rise on the west coast is on the way, and
Scientific American publishes their stuff.

And then people like "Media Truth" believe they are looking at real science.

Tidal gauges do not measure global sea level. They are mounted on land, which moves. You are correct that Scientific American magazine is mostly garbage.
 
You are making a specific claim that "every sea rise prediction from the Global Warmists have fallen short." The only way you can make that claim in good faith is if you've actually seen predictions for years that have already passed. So yes, if you're going to make a claim like that, it is your obligation to back it up.


Yeah, thing is? I haven't seen any specific predictions for 2000, or 2010, or 2018. The predictions are typically for year 2100. Here's a typical example, from the IPCC's 2007 report.


I did see one prediction in the IPCC AR3 (from 2001) for "1990 to 2025." The range is fairly broad (0.03m to 0.14m), so it is no surprise that the results definitely fall within that range. Between 1993 and 2018, sea levels have risen approximately 0.08 meters. It is not unreasonable for the final count to hit 0.11 meters, and could go higher if the rate of sea level rise continues to accelerate.

View attachment 67242264

So, there you go: One major prediction for sea level rise that is, so far, quite accurate, and likely to land on the high end rather than the low end.


Yes. Absolutely.

People are tenacious about their property; for most people, real estate is their most significant asset (and biggest liability, too). They also obviously have a strong emotional attachment to their property, even after it's been destroyed by a storm.

People are also slowly starting to realize that climate change is starting to have an impact. Around half the nation now believes that climate change is making hurricanes more intense and damaging, and that will certainly impact their decisions about rebuilding and/or retreat.

When people think "wow, this was a bad storm," they almost always rebuild. When they think "this is going to happen again, and next time it will be worse," they are more amenable to selling their land to the state for a retreat program.

As to flood insurance? All of Staten Island is eligible for flood insurance, as are most of the US coastal areas. Check the CBRS maps.

It is not possible to measure global sea level. You can't predict what you can't measure. The IPCC is not a valid source.
 
Let's consider how much of a change int he rate of sea level rise would be required for California
to see a 10 foot rise in the next 80 years.
San Francisco has one of the oldest tide gauges,
https://tidesandcurrents.noaa.gov/sltrends/sltrends_station.shtml?id=9414290
and has the century plus average at .64 feet per century,(.19 mm/yr) .
.64 feet per century is .512 feet per 80 years, so to get to 10 feet in 80 years would require a rate
19.5 times faster than what has been happening for the last century.

Tidal gauges do not measure global sea level. They are mounted on land, which moves.
 
Tidal gauges do not measure global sea level. They are mounted on land, which moves.
They measure the sea's level relative to the show where they are placed, which is all that really matters.
 
Thanks for the Math lesson. Guess what - I have an Engineering degree. I went through 3 semesters of Calculus, Differential Equations, Complex Variables, and many others. Guess what else - I will defer the Math to the experts.

If it were the case that you could do the simple sums yourself you would. That is the way with people who can.
 
Ugh. We've been over this before.

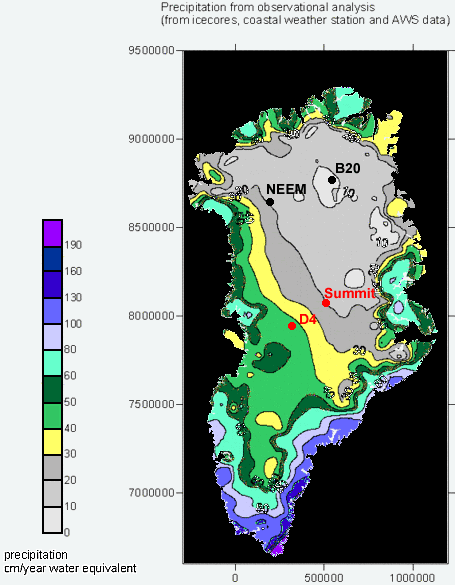
Most of the precipitation falls on the southern edges (mostly the southeast), and immediately flows into the oceans from the numerous fjords. Relatively small amounts fall directly on the ice sheet itself. You've even linked to maps which show this to be the case.

greenland-precipitation.gif


This is not the first time you've seen this map.


There are also massive rivers flowing underneath the ice sheet, as already discussed in this very thread

07_greenland_mapping.adapt.885.1.jpg


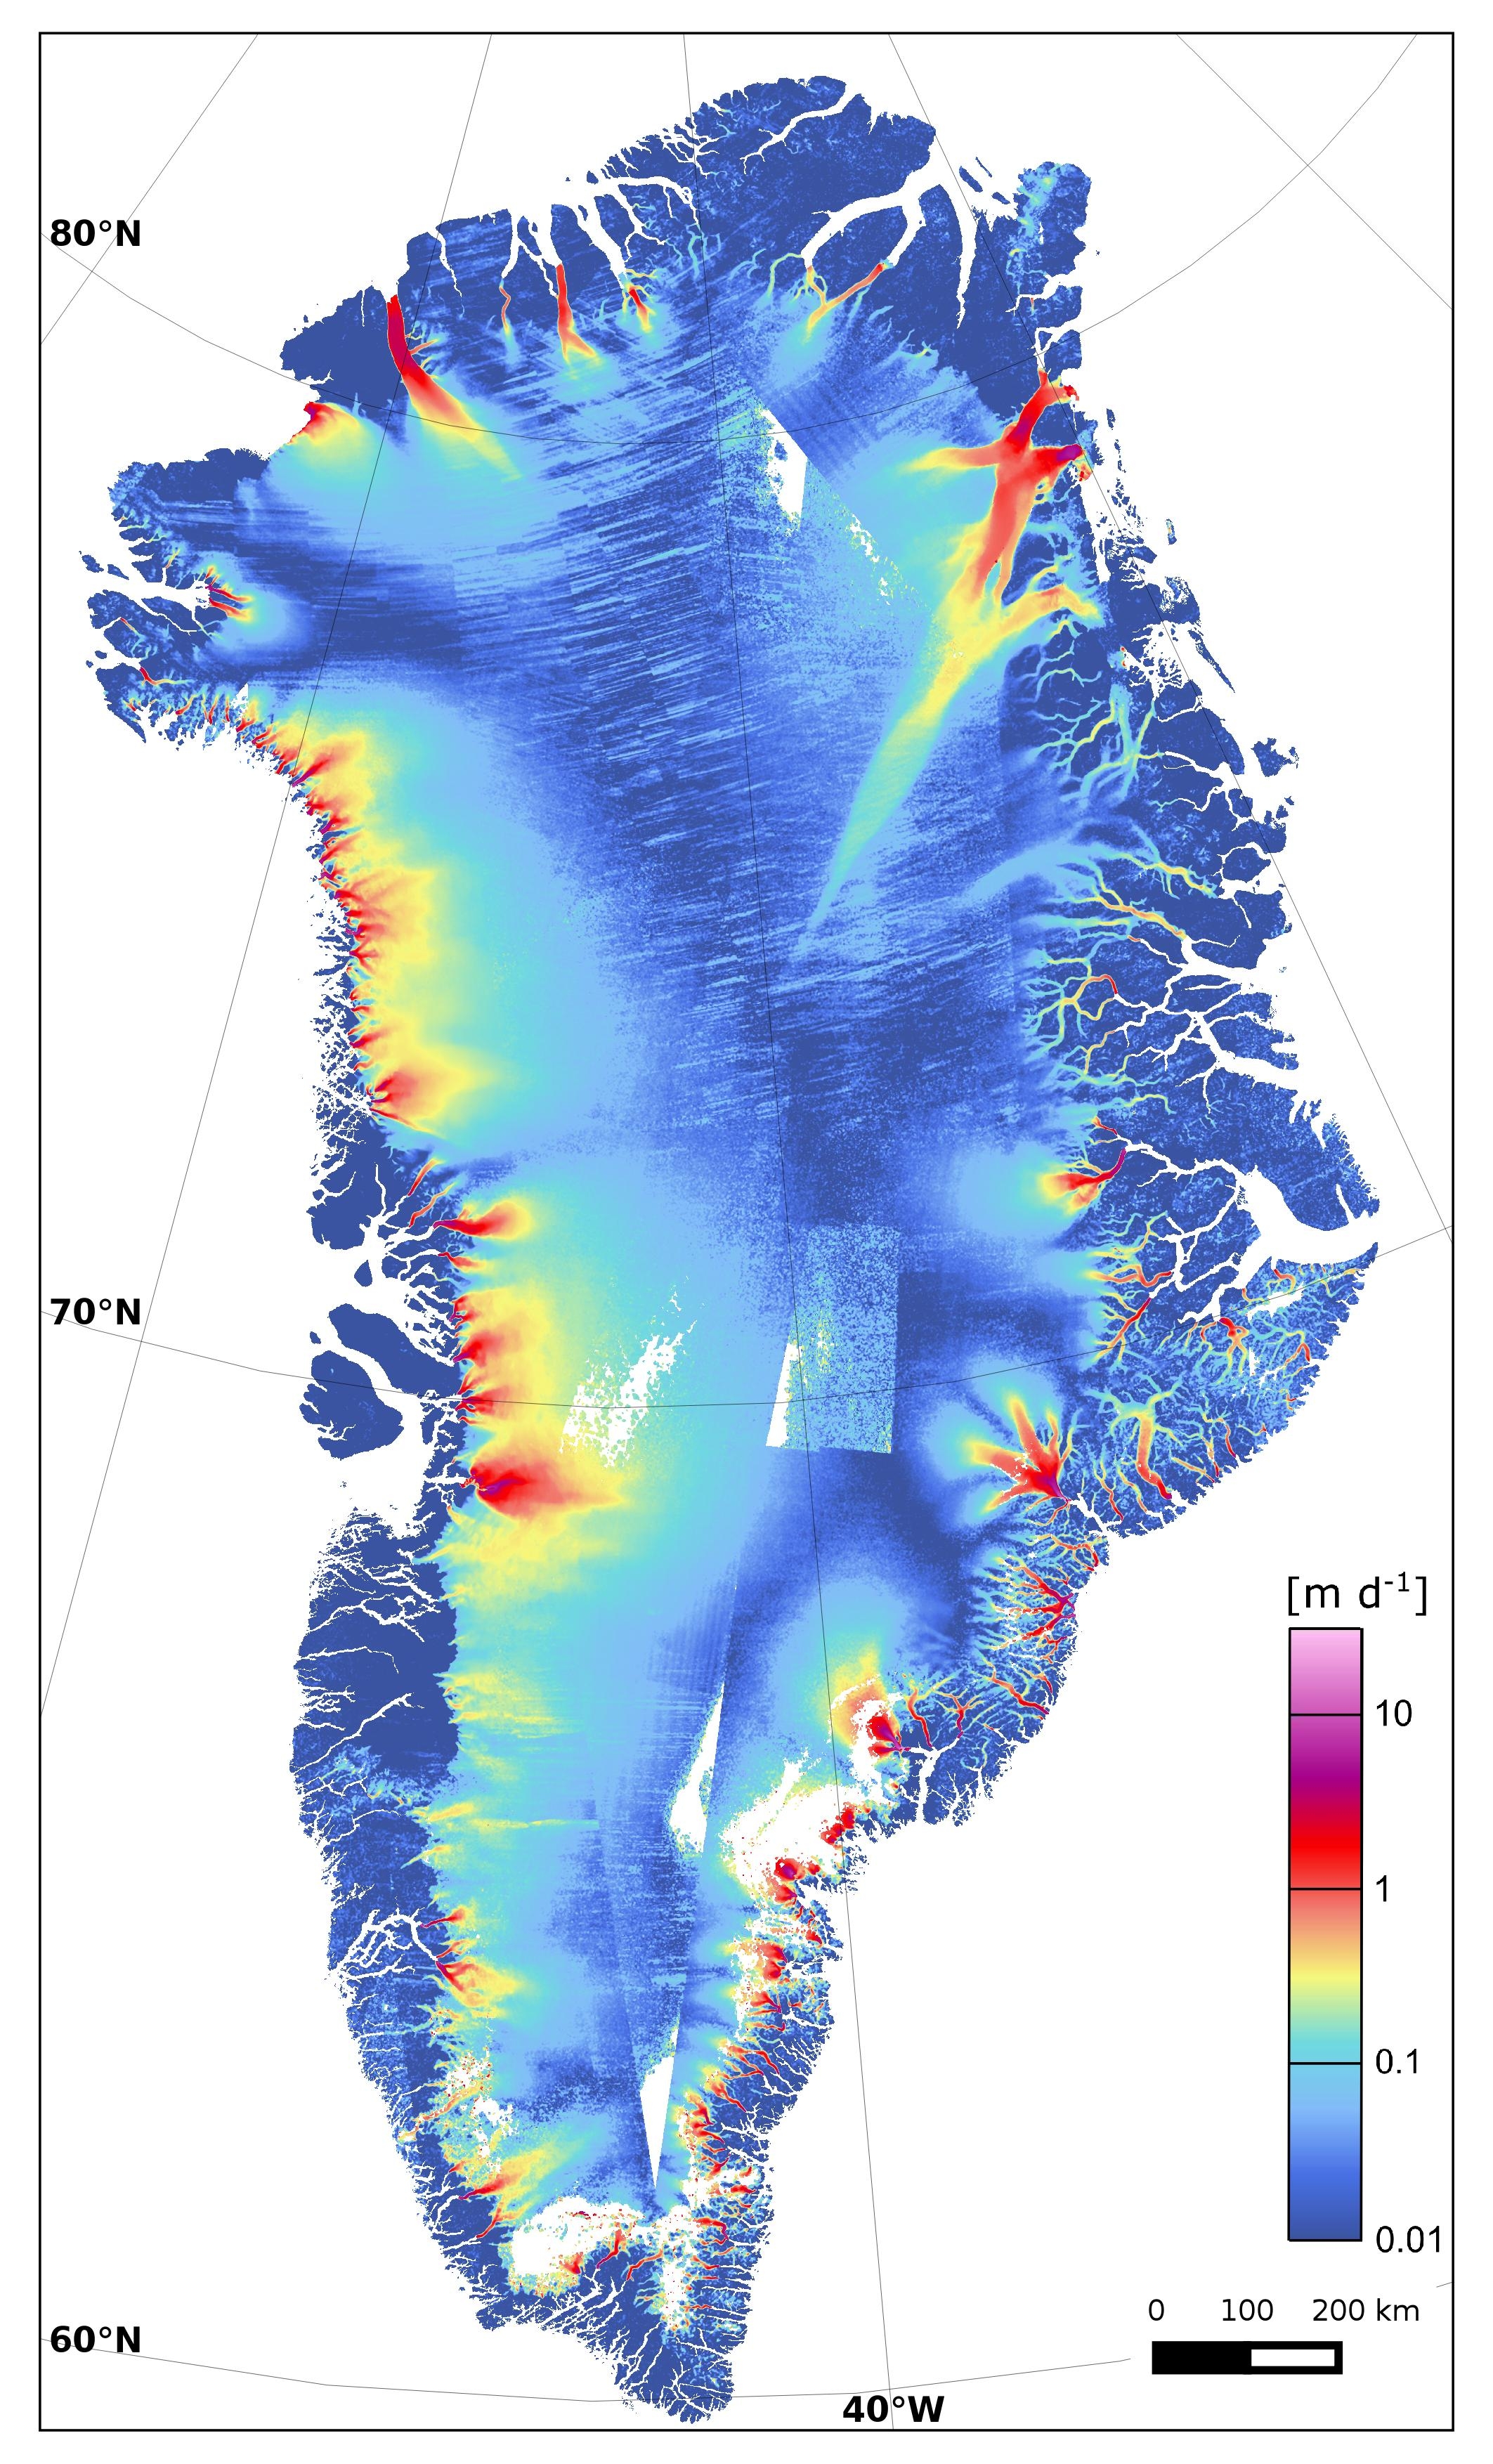
And of course, it's shedding massive amounts of ice around most of its periphery. Also already posted in this thread:

Ice_sheet_in_motion.jpg


Seriously, you really need to stop with the bad napkin math.

Yes, the snow fall w.e. is over 2.5m in places.

Yes, the outflow of liquid water is higher than the outflow of ice.

Yes, the out flow of ice can be in the form of large (tiny by Antarctic standards) ice burgs.

And all of it has to come out of the same fjords and is clearly less than the total precipitation per year.
 
Ten rules taught in Climate Science 101:

1. Never make any specific predictions on a timeline that expires before you do.
:roll:

• Since you missed it: I did find a sea level prediction that is for a period that is almost over, and the amount is accurate.

• Since you missed it: The IPCC just put out a huge report talking about likely scenarios for 2050. I'm going to guess that a good chunk of those participants will still be alive then.

• Since you missed it: We're talking specifically about sea level rise, and again, I haven't seen many predictions for levels for 2000, 2010, 2020 etc. The California report in the SciAm article you referenced, for example, starts at 2030.

• That said, scientists do make fairly specific predictions for closer time spans (just not necessarily about sea level rise). E.g. there are plenty of temperature predictions for the entire 21st century.

• If they haven't been making predictions for years like 2000, 2010, or 2020, then how can anyone proclaim that "all the predictions are wrong" ?
 
Thanks for posting that. When I click on a link to a Scientific American article this
terse little message comes up:

You have 0 complimentary articles remaining.​
I'm not sending Scientific American money for the privilege of reading their crap.

Yes there are people out there who must never look at the tide gauge record,
really believe ten feet of sea level rise on the west coast is on the way, and
Scientific American publishes their stuff.

And then people like "Media Truth" believe they are looking at real science.

When many peole here combine with the naritive that removing 40% of argricultural production from food has no effect on food price you have to wonder if we are in fact seeing some sort of paid for propaganda.
 
Let's consider how much of a change int he rate of sea level rise would be required for California
to see a 10 foot rise in the next 80 years.
San Francisco has one of the oldest tide gauges,
https://tidesandcurrents.noaa.gov/sltrends/sltrends_station.shtml?id=9414290
and has the century plus average at .64 feet per century,(.19 mm/yr) .
.64 feet per century is .512 feet per 80 years, so to get to 10 feet in 80 years would require a rate
19.5 times faster than what has been happening for the last century.
Yep.

Again, that is the highest level prediction, and for a specific area. The idea being that if a community wants to prepare for the absolute worst, they should prep for ~10 feet by 2100.

The fact that it's a significant number does not, in and of itself, prove that it's wrong -- especially since we see a dramatic escalation in ice mass loss, which will contribute far more to sea level rise than in the past.

Try actually reading the report. And by "read" I actually mean "read," not "skim to cherry-pick items that fit your agenda."
https://documents.coastal.ca.gov/reports/2018/9/w6g/w6g-9-2018-exhibits.pdf
 
You are making a specific claim that "every sea rise prediction from the Global Warmists have fallen short." The only way you can make that claim in good faith is if you've actually seen predictions for years that have already passed. So yes, if you're going to make a claim like that, it is your obligation to back it up.


Yeah, thing is? I haven't seen any specific predictions for 2000, or 2010, or 2018. The predictions are typically for year 2100. Here's a typical example, from the IPCC's 2007 report.

View attachment 67242254


I did see one prediction in the IPCC AR3 (from 2001) for "1990 to 2025." The range is fairly broad (0.03m to 0.14m), so it is no surprise that the results definitely fall within that range. Between 1993 and 2018, sea levels have risen approximately 0.08 meters. It is not unreasonable for the final count to hit 0.11 meters, and could go higher if the rate of sea level rise continues to accelerate.

View attachment 67242264

So, there you go: One major prediction for sea level rise that is, so far, quite accurate, and likely to land on the high end rather than the low end.


Yes. Absolutely.

People are tenacious about their property; for most people, real estate is their most significant asset (and biggest liability, too). They also obviously have a strong emotional attachment to their property, even after it's been destroyed by a storm.

People are also slowly starting to realize that climate change is starting to have an impact. Around half the nation now believes that climate change is making hurricanes more intense and damaging, and that will certainly impact their decisions about rebuilding and/or retreat.

When people think "wow, this was a bad storm," they almost always rebuild. When they think "this is going to happen again, and next time it will be worse," they are more amenable to selling their land to the state for a retreat program.

As to flood insurance? All of Staten Island is eligible for flood insurance, as are most of the US coastal areas. Check the CBRS maps.

So do you consider a less than 2 feet sea level rise to be a disaster for humanity?
 
You do realize that none of the of the sea level rise predictions by 2090-2099 table SPM3 are near 10 feet?
The highest one at .59 meters is 1.9 feet.
You do realize that we're talking about a report prepared by the California Coastal Commission, based on local conditions, and those are the worst-case scenario numbers? And that like I said, the result of a 6 foot rise in global average sea level means it will be higher in some coastal areas, and lower in others?
 
Yep.

Again, that is the highest level prediction, and for a specific area. The idea being that if a community wants to prepare for the absolute worst, they should prep for ~10 feet by 2100.

The fact that it's a significant number does not, in and of itself, prove that it's wrong -- especially since we see a dramatic escalation in ice mass loss, which will contribute far more to sea level rise than in the past.

Try actually reading the report. And by "read" I actually mean "read," not "skim to cherry-pick items that fit your agenda."
https://documents.coastal.ca.gov/reports/2018/9/w6g/w6g-9-2018-exhibits.pdf
Planning on 10 feet is one thing, actually expecting it is something else.
As to cherry picking, please show me the California tide station with a much higher sea level rise.
I am not saying that some areas may not be subsiding, but the Pacific sea level rise seems steady and slow.
 
You do realize that we're talking about a report prepared by the California Coastal Commission, based on local conditions, and those are the worst-case scenario numbers? And that like I said, the result of a 6 foot rise in global average sea level means it will be higher in some coastal areas, and lower in others?

Where in hell are you getting 6 foot from?
 
You do realize that we're talking about a report prepared by the California Coastal Commission, based on local conditions, and those are the worst-case scenario numbers? And that like I said, the result of a 6 foot rise in global average sea level means it will be higher in some coastal areas, and lower in others?

And still the predictions on your cited table are only 1/5 of 10 feet.
 
Yes, the snow fall w.e. is over 2.5m in places.
Which places?

Look at the map. Look at it. Which areas get most of the precipitation?


Yes, the out flow of ice can be in the form of large (tiny by Antarctic standards) ice burgs.
"Tiny by Antarctic" standards is irrelevant. Antarctica's ice shelves, for example, work very differently than Greenland's ice sheet.

What matters is that you do not understand that Greenland is massive. It is 976 miles long, 793 miles wide, and has 27,000 miles of coastland -- and again, almost all of that is fjords, where ice and water are flowing into the ocean.

greenland_size.jpg


And all of it has to come out of the same fjords and is clearly less than the total precipitation per year.
Except... it isn't. It is losing massive amounts of ice, almost every year. Based on satellite and airplane data, Greenland has lost an average of around 280 billion tons of ice per year since 2002.

It is astounding how you continue to peddle your false narrative, no matter how many times and how many ways you are shown that you are vastly underestimating the water and ice flows from Greenland.
 
When many peole here combine with the naritive that removing 40% of argricultural production from food has no effect on food price you have to wonder if we are in fact seeing some sort of paid for propaganda.
:roll:

Please. Your ideas about Greenland and food supplies are both of disastrously low quality. Resorting to ad hominem attacks does not magically fix the factual and logical errors of your claims.
 
Which places?

Look at the map. Look at it. Which areas get most of the precipitation?


"Tiny by Antarctic" standards is irrelevant. Antarctica's ice shelves, for example, work very differently than Greenland's ice sheet.

What matters is that you do not understand that Greenland is massive. It is 976 miles long, 793 miles wide, and has 27,000 miles of coastland -- and again, almost all of that is fjords, where ice and water are flowing into the ocean.

View attachment 67242280


Except... it isn't. It is losing massive amounts of ice, almost every year. Based on satellite and airplane data, Greenland has lost an average of around 280 billion tons of ice per year since 2002.

It is astounding how you continue to peddle your false narrative, no matter how many times and how many ways you are shown that you are vastly underestimating the water and ice flows from Greenland.

Greenland is massive. Yes. Not sure that your projection may have some error in it due to the cut and paste vs sphere of the earth etc.

That massive land mass has an avergae of 320mm precipitation per year. It has, unlike the area of drainage of the Mississippi, vertually no evaporation and no evapotranspiration at all to speak of.

All (99%+) of the snowfall must either come out of the fjords or be stored in the ice of the central ice sheet.

If there is a greater than input of out flow then it will lose icve mass.

Can you find any fjord which has a flow rate 1/5 of the Mississippi? Please cite it and we can all have a look on google maps and see if you have managed it.
 
Planning on 10 feet is one thing, actually expecting it is something else.
Read the report.


As to cherry picking, please show me the California tide station with a much higher sea level rise.
Read the report.


I am not saying that some areas may not be subsiding, but the Pacific sea level rise seems steady and slow.
Read the report.
 
:roll:

Please. Your ideas about Greenland and food supplies are both of disastrously low quality. Resorting to ad hominem attacks does not magically fix the factual and logical errors of your claims.

Explore further: Scientists flag global food pricing too hot to ignore

More information: Marco Lagi et al. Accurate market price formation model with both supply-demand and trend-following for global food prices providing policy recommendations, Proceedings of the National Academy of Sciences (2015). DOI: 10.1073/pnas.1413108112

https://phys.org/news/2015-10-role-food-prices-syrian-crisis.html

I understand that thinking for yourself is way beyond your imagination or confidence.

So this will, I hope, show you that people who have been socially anoited as clever have the same ideas as me. Using land which should grow food to make fuel is evil.
 
Read the report.


Read the report.


Read the report.

The report is a joke! It shows that the California projection, is way about the average of the literature predictions.
 
Learn to read.

Back at you!
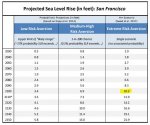
Probabilistic projections for the height of sea level rise and the H++ scenario are presented. The H++
projection is a single scenario and does not have an associated likelihood of occurrence.
Projections are with respect to a baseline year of 2000 (or more specifically, the average relative sea level over 1991-2009)
. Table is adapted from the 2018 OPC SLR Guidance to present only the three scenarios OPC recommends evaluating
. Additionally, while the OPC tables include low emissions scenarios, only high emissions scenarios,
which represent RCP 8.5, are included here because global greenhouse gas emissions are currently tracking along
this trajectory.
and
A second significant source of uncertainty is related to the dynamics of ice sheet loss. This topic has continued to be
extensively researched since the NRC report was published, and recent studies have since informed updated statewide guidance.
In April 2017, a Working Group of the Ocean Protection Council’s Science Advisory Team released a report
synthesizing current sea level rise science. The report, titled Rising Seas in California: An Update on Sea-Level Rise Science
, presents advances in sea level rise modeling, notably
including improved understanding of the processes that could drive extreme global sea
level rise from ice loss from the Greenland and Antarctic ice sheets. A significant finding
from this report is that Antarctic ice sheet loss could have an outsized impact on sea level
rise in California compared to the global average due to ocean circulation dynamics.
Further, the report states that rapid ice sheet loss could result in upwards of 10 feet of sea
level rise along the California coast by 2100
(this scenario is referred as an “extreme scenario” or “H++ scenario” throughout the OPC Science Report and this Guidance).
Both RCP8.5 and losses from both the Greenland and Antarctic ice sheets!
No wonder they do not attach a probability.
 
That massive land mass has an avergae of 320mm precipitation per year. It has, unlike the area of drainage of the Mississippi, vertually no evaporation and no evapotranspiration at all to speak of.
Yet again. Look at the map. Tell us where the precipitation is hitting.


If there is a greater than input of out flow then it will lose icve mass.
Yes, and if there is more ice and water flowing off of the ice sheets... which is what we are seeing... then the total ice mass of Greenland will drop. See how that works?


Can you find any fjord which has a flow rate 1/5 of the Mississippi? Please cite it and we can all have a look on google maps and see if you have managed it.
lol

Okay. The Isortoq River discharges at from 23,000 to 46,000 cubic feet per second during melt season. That's just one of about 100 rivers in Greenland. (In comparison, the Mississippi discharges about 16,000 cubic feet per second.) You can also look into the Watson River, the Majorqaq River, the Qinnguata Kuussua... There are lots of rivers in Greenland which empty into the oceans (basically via the fjords)

I'm sure you could also spend a few years learning about actual hydrology, and thus gain enough knowledge to sort through the National Snow & Ice Data Center's records to get a more comprehensive feel for discharge rates. Or, maybe you ought to stop while you're ahead, and accept that the people with PhDs in the appropriate fields, and study these topics for years on end, actually know what they're talking about.
 
Yet again. Look at the map. Tell us where the precipitation is hitting.


Yes, and if there is more ice and water flowing off of the ice sheets... which is what we are seeing... then the total ice mass of Greenland will drop. See how that works?


lol

Okay. The Isortoq River discharges at from 23,000 to 46,000 cubic feet per second during melt season. That's just one of about 100 rivers in Greenland. (In comparison, the Mississippi discharges about 16,000 cubic feet per second.) You can also look into the Watson River, the Majorqaq River, the Qinnguata Kuussua... There are lots of rivers in Greenland which empty into the oceans (basically via the fjords)

I'm sure you could also spend a few years learning about actual hydrology, and thus gain enough knowledge to sort through the National Snow & Ice Data Center's records to get a more comprehensive feel for discharge rates. Or, maybe you ought to stop while you're ahead, and accept that the people with PhDs in the appropriate fields, and study these topics for years on end, actually know what they're talking about.

Yes, but the important thing is...CAN YOU DO HIS SUMS?
 
Back
Top Bottom