• This is a political forum that is non-biased/non-partisan and treats every person's position on topics equally. This debate forum is not aligned to any political party. In today's politics, many ideas are split between and even within all the political parties. Often we find ourselves agreeing on one platform but some topics break our mold. We are here to discuss them in a civil political debate. If this is your first visit to our political forums, be sure to check out the RULES. Registering for debate politics is necessary before posting. Register today to participate - it's free!

NYT: Harrowing Storms May Move Climate Debate, if Not G.O.P. Leaders

Same thing I said to Jackie Boy. You are ignoring HARD SCIENCE facts. Why do you think this is hurricane season? Because the ocean (and air) waters are warmer this time of year, in the Northern hemisphere, adding energy to the storms. Add the 1.2 deg F, which is the rise in temperature from 50 years ago, and the problem exacerbates.

And I don't know what planet you've been living on. Sandy (2012) was one of the worst hurricane-turned-storms in history, in that it was 900 miles wide. Contrast that with Katrina, which was only 300 miles wide. Over $50 Billion in damage by Sandy. The recent Irma flooded Jacksonville, FL, but this isn't the only flooding of JAX. Obama visited during fairly recent floods, and declared it a disaster area. There have been plenty of recent floods throughout the US.

"In history!" BFD. It only been occupied for around 300 years - excluding the Indians. So you can't predict the future with crackpot, half assed climate models that ignore inputs they don't like. BTW, what water temperature are you trying to a achieve?
 
Are you disagreeing with my statement, or do you want to continue to argue ghosts? Thank you for agreeing with the statement - in advance.

It's fun watching when you guys scramble to get off a certain point.
 
Then why has hurricane season been virtually dead for many years. Has the air and water just started warming in the last few weeks? :roll:

The still can't wrap their indoctrinated minds to the concept of what "cyclical" means.
 
So you don't believe the scientists that tell you that warmer air and warmer temperatures add to the the energy of hurricanes?

How many acres of that particular straw did you plant?

You sure love your strawmen and logical fallacies.
 
I know about the Labor Day hurricane of 1935, but this doesn't answer the question.

Do you believe the scientists that tell you that warmer air and warmer temperatures add to the the energy of hurricanes?

How much does it add?

25%?

15%?

2%?

.0000005%?

Do you have a number for us?

Do you have a paper for us that has a DOI number attached?
 
How much does it add?

25%?

15%?

2%?

.0000005%?

Do you have a number for us?

Do you have a paper for us that has a DOI number attached?

The actual numbers from IPCC models are between 2% and 11% increase in hurricane intensity by the end of the 21st century. Assuming a linear relationship, we are 17% of the way to the end of the century. So currently our increase in hurricane intensity would stand between 0.34% and 1.87%. Rainfall rates associated with hurricanes will increase by 10-15% by the end of the century, which puts us currently at 1.7% to 2.6%.

https://www.gfdl.noaa.gov/global-warming-and-hurricanes/
Anthropogenic warming by the end of the 21st century will likely cause tropical cyclones globally to be more intense on average (by 2 to 11% according to model projections for an IPCC A1B scenario). This change would imply an even larger percentage increase in the destructive potential per storm, assuming no reduction in storm size.

There are better than even odds that anthropogenic warming over the next century will lead to an increase in the occurrence of very intense tropical cyclone in some basins–an increase that would be substantially larger in percentage terms than the 2-11% increase in the average storm intensity. This increase in intense storm occurrence is projected despite a likely decrease (or little change) in the global numbers of all tropical cyclones.

Anthropogenic warming by the end of the 21st century will likely cause tropical cyclones to have substantially higher rainfall rates than present-day ones, with a model-projected increase of about 10-15% for rainfall rates averaged within about 100 km of the storm center.


There are two ways to look at this data. First, one can say the percentages are small. However, using a modest 2% for argument's sake, a 24-hour storm, with flooding, could be extended for another 30 minutes. A lot can happen in that 30 minutes. A dam could give way. Another neighborhood could flood. Water could penetrate an area of electrical equipment. Somebody could be killed in that 30 minutes. When one is the midst of a disaster, 30 minutes is a long time. And that 30 minutes will be more than 60 minutes, for out next generation, and about 100 minutes for the generation after that.

models...

Yet they don't hindsight well at all.

This is interesting, from your NOAA link:


Existing records of past Atlantic tropical storm or hurricane numbers (1878 to present) in fact do show a pronounced upward trend, which is also correlated with rising SSTs (e.g., see blue curve in Fig. 4 or Vecchi and Knutson 2008). However, the density of reporting ship traffic over the Atlantic was relatively sparse during the early decades of this record, such that if storms from the modern era (post 1965) had hypothetically occurred during those earlier decades, a substantial number would likely not have been directly observed by the ship-based “observing network of opportunity.” We find that, after adjusting for such an estimated number of missing storms, there is a small nominally positive upward trend in tropical storm occurrence from 1878-2006. But statistical tests reveal that this trend is so small, relative to the variability in the series, that it is not significantly distinguishable from zero

They adjust for assumed storms not seen, and have a statistical zero trend.
 
What have I already said about our not having proper observation?

Now again...

1935 had the worse storm on record. Doesn't it stand to reason the storms we didn't see due to no satellite coverage were also worse?
 
models...

Yet they don't hindsight well at all.

This is interesting, from your NOAA link:


Existing records of past Atlantic tropical storm or hurricane numbers (1878 to present) in fact do show a pronounced upward trend, which is also correlated with rising SSTs (e.g., see blue curve in Fig. 4 or Vecchi and Knutson 2008). However, the density of reporting ship traffic over the Atlantic was relatively sparse during the early decades of this record, such that if storms from the modern era (post 1965) had hypothetically occurred during those earlier decades, a substantial number would likely not have been directly observed by the ship-based “observing network of opportunity.” We find that, after adjusting for such an estimated number of missing storms, there is a small nominally positive upward trend in tropical storm occurrence from 1878-2006. But statistical tests reveal that this trend is so small, relative to the variability in the series, that it is not significantly distinguishable from zero

They adjust for assumed storms not seen, and have a statistical zero trend.

Your blowing hot air again. The models are extremely accurate, according to the very thorough National Climate Assessment of 2014. These scientists know a lot more than your uneducated diatribe...

Over recent decades, climate science has advanced significantly. Increased scrutiny has led to increased certainty that we are now seeing impacts associated with human-induced climate change. With each passing year, the accumulating evidence further expands our understanding and extends the record of observed trends in temperature, precipitation, sea level, ice mass, and many other variables recorded by a variety of measuring systems and analyzed by independent research groups from around the world. It is notable that as these data records have grown longer and climate models have become more comprehensive, earlier predictions have largely been confirmed. The only real surprises have been that some changes, such as sea level rise and Arctic sea ice decline, have outpaced earlier projections.

Overview | National Climate Assessment

Interesting.

You are saying they know more than NOAA?

Who would have guess. I guess it's your confirmation bias picking sides, huh?

Have you figured out yet why 3-phase power is used?
 
Interesting.

You are saying they know more than NOAA?

Who would have guess. I guess it's your confirmation bias picking sides, huh?

Have you figured out yet why 3-phase power is used?

Again, I see no link to support your statement.
 
My information for NOAA was in the link you posted!

My God man...

Get with the program!

The statement from the National Climate Assessment said that the models were extremely accurate. Now then - what do the models say? You were speaking about only about numbers of hurricanes. Here's the conclusion, which states numbers are unknown, but that the hurricanes will get more intense, with more water, due to warmer sea surface temperatures.

The strongest hurricanes in the present climate may be upstaged by even more intense hurricanes over the next century as the earth’s climate is warmed by increasing levels of greenhouse gases in the atmosphere. Although we cannot say at present whether more or fewer hurricanes will occur in the future with global warming, the hurricanes that do occur near the end of the 21st century are expected to be stronger and have significantly more intense rainfall than under present day climate conditions. This expectation (Figure 11) is based on an anticipated enhancement of energy available to the storms due to higher tropical sea surface temperatures.
 
Last edited:
The statement from the National Climate Assessment said that the models were extremely accurate. Now then - what do the models say? You were speaking about only about numbers of hurricanes. Here's the conclusion, which states numbers are unknown, but that the hurricanes will get more intense, with more water, due to warmer sea surface temperatures.

The strongest hurricanes in the present climate may be upstaged by even more intense hurricanes over the next century as the earth’s climate is warmed by increasing levels of greenhouse gases in the atmosphere. Although we cannot say at present whether more or fewer hurricanes will occur in the future with global warming, the hurricanes that do occur near the end of the 21st century are expected to be stronger and have significantly more intense rainfall than under present day climate conditions. This expectation (Figure 11) is based on an anticipated enhancement of energy available to the storms due to higher tropical sea surface temperatures.

Speculation not borne out by observations through the present.
 
Speculation not borne out by observations through the present.

When I cross a bridge, I trust that the bridge will hold up, because I trust in Science. When I visit a doctor, I usually heed his advise, because I trust in Science.....

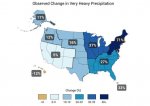
That said, there is no question that we are already seeing more water, associated with extreme weather events and hurricanes already. Here's the graph again to support this. It may be too early to tell, regarding hurricane intensity.

heavy-precip_US.jpg
 
The statement from the National Climate Assessment said that the models were extremely accurate. Now then - what do the models say? You were speaking about only about numbers of hurricanes. Here's the conclusion, which states numbers are unknown, but that the hurricanes will get more intense, with more water, due to warmer sea surface temperatures.

The strongest hurricanes in the present climate may be upstaged by even more intense hurricanes over the next century as the earth’s climate is warmed by increasing levels of greenhouse gases in the atmosphere. Although we cannot say at present whether more or fewer hurricanes will occur in the future with global warming, the hurricanes that do occur near the end of the 21st century are expected to be stronger and have significantly more intense rainfall than under present day climate conditions. This expectation (Figure 11) is based on an anticipated enhancement of energy available to the storms due to higher tropical sea surface temperatures.

If you wish to believe government propaganda then what can I say. NOAA says otherwise on your claim.


A team of more than 300 experts guided by a 60-member Federal Advisory Committee

Di you think those "experts" would have a job if they disagreed with the federal advisors?

Do you trust the government that much?

And... just what are these "experts" credentials?

You hang your hat in the silliest of places.
 
When I cross a bridge, I trust that the bridge will hold up, because I trust in Science. When I visit a doctor, I usually heed his advise, because I trust in Science.....

That said, there is no question that we are already seeing more water, associated with extreme weather events and hurricanes already. Here's the graph again to support this. It may be too early to tell, regarding hurricane intensity.

View attachment 67223056

We went over this...

More water on the 1% events. So? Annual precipitation is how much more, or less? Do you know?
 
When I cross a bridge, I trust that the bridge will hold up, because I trust in Science. When I visit a doctor, I usually heed his advise, because I trust in Science.....

That said, there is no question that we are already seeing more water, associated with extreme weather events and hurricanes already. Here's the graph again to support this. It may be too early to tell, regarding hurricane intensity.

View attachment 67223056

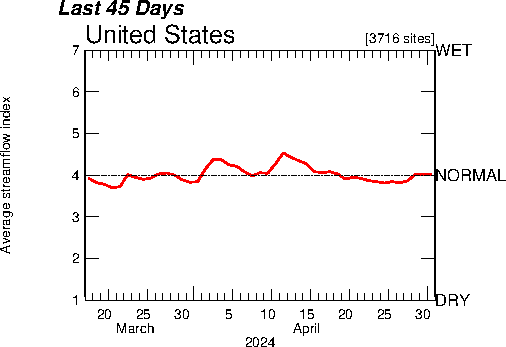
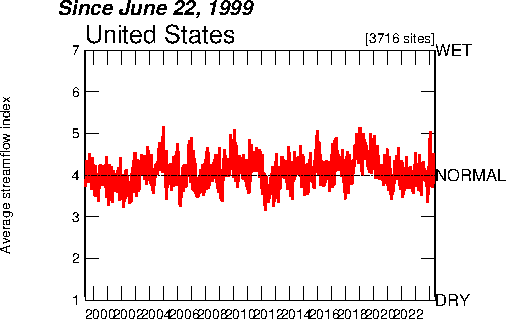
Sorry, not more water.

USGS WaterWatch -- Streamflow conditions

https://waterwatch.usgs.gov/


WaterWatch Streamflow Map Choose a region and then click "GO" to view a regional map (Warning: It may take several minutes to process) ...

Map | Map (HCDN) | Flow Table | Summary Plot | Percent Summary | Summary Table | Web Map | Google Earth

[FONT=&quot]Time series plot of real-time streamflow compared to historical streamflow for the day of the year (United States)

StateUnited StatesAlabamaAlaskaArizonaArkansasCaliforniaColoradoConnecticutDelawareDistrict of ColumbiaFloridaGeorgiaHawaiiIdahoIllinoisIndianaIowaKansasKentuckyLouisianaMaineMarylandMassachusettsMichiganMinnesotaMississippiMissouriMontanaNebraskaNevadaNew HampshireNew JerseyNew MexicoNew YorkNorth CarolinaNorth DakotaOhioOklahomaOregonPennsylvaniaRhode IslandSouth CarolinaSouth DakotaTennesseeTexasUtahVermontVirginiaWashingtonWest VirginiaWisconsinWyomingPuerto RicoorWater-Resources Regions01 New England02 Mid Atlantic03 South Atlantic-Gulf04 Great Lakes05 Ohio06 Tennessee07 Upper Mississippi08 Lower Mississippi09 Souris-Red-Rainy10 Missouri11 Arkansas-White-Red12 Texas-Gulf13 Rio Grande14 Upper Colorado15 Lower Colorado16 Great Basin17 Pacific Northwest18 California19 Alaska20 Hawaii21 Puerto Rico

real_us_1.gif
real_us_2.gif

[/FONT]
 
If you wish to believe government propaganda then what can I say. NOAA says otherwise on your claim.


A team of more than 300 experts guided by a 60-member Federal Advisory Committee

Di you think those "experts" would have a job if they disagreed with the federal advisors?

Do you trust the government that much?

And... just what are these "experts" credentials?

You hang your hat in the silliest of places.

There is no disagreement. I pointed that out.
 
We went over this...

More water on the 1% events. So? Annual precipitation is how much more, or less? Do you know?

Those 1% events are the ones that cause billions of dollars worth of damage.
 
Sorry, not more water.

USGS WaterWatch -- Streamflow conditions

https://waterwatch.usgs.gov/


WaterWatch Streamflow Map Choose a region and then click "GO" to view a regional map (Warning: It may take several minutes to process) ...

Map | Map (HCDN) | Flow Table | Summary Plot | Percent Summary | Summary Table | Web Map | Google Earth

[FONT="]Time series plot of real-time streamflow compared to historical streamflow for the day of the year (United States)

StateUnited StatesAlabamaAlaskaArizonaArkansasCaliforniaColoradoConnecticutDelawareDistrict of ColumbiaFloridaGeorgiaHawaiiIdahoIllinoisIndianaIowaKansasKentuckyLouisianaMaineMarylandMassachusettsMichiganMinnesotaMississippiMissouriMontanaNebraskaNevadaNew HampshireNew JerseyNew MexicoNew YorkNorth CarolinaNorth DakotaOhioOklahomaOregonPennsylvaniaRhode IslandSouth CarolinaSouth DakotaTennesseeTexasUtahVermontVirginiaWashingtonWest VirginiaWisconsinWyomingPuerto RicoorWater-Resources Regions01 New England02 Mid Atlantic03 South Atlantic-Gulf04 Great Lakes05 Ohio06 Tennessee07 Upper Mississippi08 Lower Mississippi09 Souris-Red-Rainy10 Missouri11 Arkansas-White-Red12 Texas-Gulf13 Rio Grande14 Upper Colorado15 Lower Colorado16 Great Basin17 Pacific Northwest18 California19 Alaska20 Hawaii21 Puerto Rico

real_us_1.gif
real_us_2.gif

[/FONT]

Stream flow is irrelevant. It only indicates average rainfall, which as pointed out, is not the critical statistic, like the 1% events.
 
Article today about how recent extreme weather events are starting to move the conversation about climate change. The issue is still deeply polarizing, and some "Red State" politicians still have certain linguistic problems actually using the correct terms, but still have to deal with constituents who are feeling the effects of climate change. And we've only just begun.

“The conversation is shifting,” said Senator Brian Schatz, Democrat of Hawaii. “Because even if you don’t believe liberals, even if you don’t believe scientists, you can believe your own eyes.”...

“We can get a fair amount of bipartisanship if we talk about severe weather and resiliency,” Mr. Schatz said. “For some people, it’s just about the phrase ‘climate change’ being too politically loaded.”


https://www.nytimes.com/2017/09/14/us/irma-harvey-climate-politics.html

So weather IS Climate?
 
Stream flow is irrelevant. It only indicates average rainfall, which as pointed out, is not the critical statistic, like the 1% events.

Streamflow is actually the only precipitation measure that matters. It's not "average" rainfall, it's cumulative rainfall. You see, water flows downhill.

The type of event (extreme or otherwise) is a matter of mere weather. Cumulative rainfall is a matter of climate.
 
Land Surface Air Temperature Data / Sea Surface Temperature
[h=1]Gulf Summers Aren’t Global Averages: A Reply to Farron Cousins[/h]Alan Reynolds, Senior Fellow, Cato Institute DeSmogBlog contributor Farron Cousins writes, “Newsweek Gives Cato Institute Climate Denier A Platform.” That means my piece, “Hurricanes Harvey and Irma Can’t Be Blamed on Global Warming.” But how could I possibly be a “Climate Denier” when I openly accepted NASA’s estimate that “Globally-averaged temperatures in 2016 were 1.78…
 
Those 1% events are the ones that cause billions of dollars worth of damage.

And always have had a factor of cost relative to the cost of living and population density.

Once again, inadequate storm sewer systems are the biggest cause for increases of damage above normal parameters. We cover the absorptive property of the earth with buildings, concrete, and asphalt. Then divert rainwater to storm sewers, not built to capacity for these 1% precipitation events.
 
Back
Top Bottom