• This is a political forum that is non-biased/non-partisan and treats every person's position on topics equally. This debate forum is not aligned to any political party. In today's politics, many ideas are split between and even within all the political parties. Often we find ourselves agreeing on one platform but some topics break our mold. We are here to discuss them in a civil political debate. If this is your first visit to our political forums, be sure to check out the RULES. Registering for debate politics is necessary before posting. Register today to participate - it's free!

The Intellectual Dishonesty of the 1998 Global Warming Pause

Heat waves:


Heat and drought:


Precip:


and more


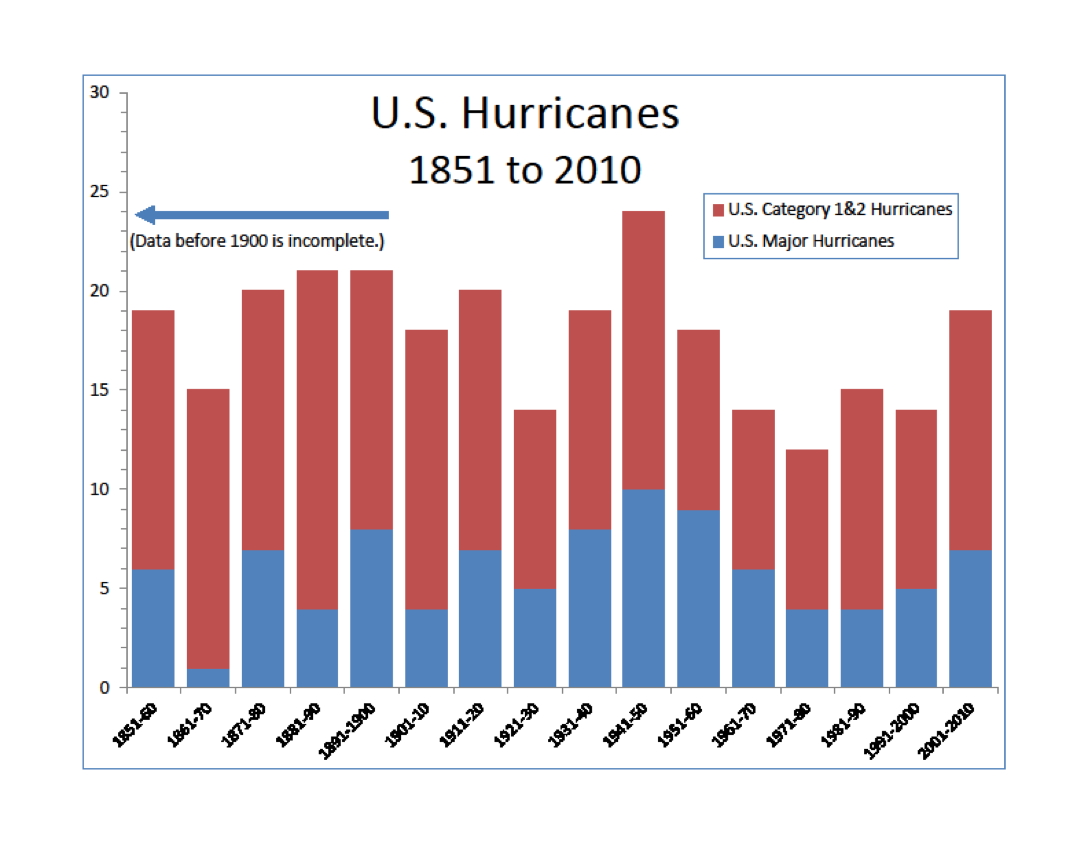
Category 5 hurricanes:


Which is to be expected, particularly since no one is disputing AGW, and one of the predicted consequences of AGW is an increase in extreme weather events.


Time series plot of real-time streamflow compared to historical streamflow for the day of the year (United States)


real_us_1.gif
real_us_2.gif


Current Streamflow - USGS WaterWatch

https://waterwatch.usgs.gov/?id=ww_current


map legend · Texas Flood · Home · Current Streamflow · Flood · Drought · Past Flow/Runoff · Animation · Toolkit · Annual Summaries · Additional Information ...
 
Seems like a kind of long gap between cat 5 hurricanes, then three in two years, then Harvey..

and other extremes of weather as well.

No one living in this day and age can possibly fail to understand that the weather is changing where they are. A 500 year drought followed by record rain and snowfall here has begun to convince people that weather is getting more extreme.

But, that's just here. No doubt the folks in India think their weather is just normal everyday rain.

Days Between Major Hurricane (Cat 3, 4, 5) Landfalls in the US 1900 – 2014
Roger Pielke, Jr. – Center for Science and Technology Policy Research – University of Colorado at Boulder – Washington Post – Click to enlarge
US Hurricane Landfalls 1900 – 2013
Roger Pielke, Jr. – Center for Science and Technology Policy Research – University of Colorado at Boulder – Click to enlarge
US Extremes in Landfalling Tropical Systems – 1910 to Present – Annual
National Oceanic and Atmospheric Administration (NOAA) – National Climatic Data Center (NCDC) – Click the pic to view at source
US Hurricanes 1851 – 2010
National Oceanic and Atmospheric Administration (NOAA) – Atlantic Oceanographic and Meteorological Laboratory – (AOML) – Click the pic to view at source


[FONT=&]Time series plot of real-time streamflow compared to historical streamflow for the day of the year (United States)


real_us_1.gif
real_us_2.gif

[/FONT]


Current Streamflow - USGS WaterWatch

https://waterwatch.usgs.gov/?id=ww_current


map legend · Texas Flood · Home · Current Streamflow · Flood · Drought · Past Flow/Runoff · Animation · Toolkit · Annual Summaries · Additional Information ...

Streamflow?
I can tell you that the streams around here are flowing a lot faster than they were this time last year.

Unprecedented drought, followed by wettest winter in 500 years will affect stream flows.
 
Days Between Major Hurricane (Cat 3, 4, 5) Landfalls in the US 1900 – 2014
Roger Pielke, Jr. – Center for Science and Technology Policy Research – University of Colorado at Boulder – Washington Post – Click to enlarge
US Hurricane Landfalls 1900 – 2013
Roger Pielke, Jr. – Center for Science and Technology Policy Research – University of Colorado at Boulder – Click to enlarge
US Extremes in Landfalling Tropical Systems – 1910 to Present – Annual
National Oceanic and Atmospheric Administration (NOAA) – National Climatic Data Center (NCDC) – Click the pic to view at source
US Hurricanes 1851 – 2010
National Oceanic and Atmospheric Administration (NOAA) – Atlantic Oceanographic and Meteorological Laboratory – (AOML) – Click the pic to view at source


We've always had hurricanes, nothing new there.
Category 5 hurricanes are something of a rarity, and do fit the definition of extreme weather event.

So do floods and droughts. Come here and take a look at how many 100 year old pines and firs are dead of drought, then tell California that there are no extremes of weather.
 
Streamflow?
I can tell you that the streams around here are flowing a lot faster than they were this time last year.

Unprecedented drought, followed by wettest winter in 500 years will affect stream flows.

Not in the aggregate. Are you challenging the USGS data?
 
We've always had hurricanes, nothing new there.
Category 5 hurricanes are something of a rarity, and do fit the definition of extreme weather event.

So do floods and droughts. Come here and take a look at how many 100 year old pines and firs are dead of drought, then tell California that there are no extremes of weather.

Of course there are extremes -- an average amount.
 
We've always had hurricanes, nothing new there.
Category 5 hurricanes are something of a rarity, and do fit the definition of extreme weather event.

So do floods and droughts. Come here and take a look at how many 100 year old pines and firs are dead of drought, then tell California that there are no extremes of weather.


[h=1]Scientists link California droughts and floods to distinctive atmospheric waves[/h]From NCAR/UCAR: BOULDER, Colo. — The crippling wintertime droughts that struck California from 2013 to 2015, as well as this year’s unusually wet California winter, appear to be associated with the same phenomenon: a distinctive wave pattern that emerges in the upper atmosphere and circles the globe. Scientists at the National Center for Atmospheric Research…

April 6, 2017 in Climate News.
 
Not in the aggregate. Are you challenging the USGS data?

I'm not sure what your point is. If you average streamflows, you get an average. There is no way that streams flow the same one year as opposed to the next. Streams depend on precipitation. Are you trying to say that precipitation is holding constant, no extreme droughts or rain/snow events?
 

[h=1]Scientists link California droughts and floods to distinctive atmospheric waves[/h]From NCAR/UCAR: BOULDER, Colo. — The crippling wintertime droughts that struck California from 2013 to 2015, as well as this year’s unusually wet California winter, appear to be associated with the same phenomenon: a distinctive wave pattern that emerges in the upper atmosphere and circles the globe. Scientists at the National Center for Atmospheric Research…

April 6, 2017 in Climate News.

Sounds about right.
What are warmer temps doing to those atmospheric waves?
 
I'm not sure what your point is. If you average streamflows, you get an average. There is no way that streams flow the same one year as opposed to the next. Streams depend on precipitation. Are you trying to say that precipitation is holding constant, no extreme droughts or rain/snow events?

Yes. In the aggregate in the US.
 
Oh, I dunno... I suppose we'll adjust to huge amounts of rain in some places, no more rain in others, colder temps in a few places, hotter in others, farmers always do well when the climate they're used to suddenly changes. Look how well the dustbowl turned out back in the '30s. Nope, nothing to worry about at all. Hurricanes are good, as they get people to pull together.

Is it your claim that greenhouse gasses cause the dust bowl?
 

Chinese Scientists Confirm Warming Hiatus For China, 2001-2015

From “the pause is a fact” department and The GWPF A regional warming hiatus is diagnosed for the period 2001–2015 in China. Greenhouse gases-induced warming is suppressed by natural variability. Satellite-based regional warming hiatus in China and its implication Science of The Total Environment, https://doi.org/10.1016/j.scitotenv.2018.08.233 Jiangsu Center for Collaborative Innovation in Geographical Information Resource Development and…
Continue reading →

[h=3]Satellite-based regional warming hiatus in China and its implication[/h][h=3]Science of The Total Environment, https://doi.org/10.1016/j.scitotenv.2018.08.233[/h][FONT=&quot]Jiangsu Center for Collaborative Innovation in Geographical Information Resource Development and Application, Key Laboratory of Virtual Geographic Environment of Ministry of Education, College of Geographic Science, Nanjing Normal University, Nanjing 210023, China


[/FONT]

[FONT=&quot][h=2]Abstract[/h]The slowdown in global warming since 1998, often termed the global warming hiatus. Reconciling the “hiatus” is a main focus in the 2013 climate change conference. Accurately characterizing the spatiotemporal trends in surface air temperature (SAT) is helps to better understand the “hiatus” during the period. This article presents a satellite-based regional warming simulation to diagnose the “hiatus” for 2001–2015 in China. Results show that the rapid warming is mainly in western and southern China, such as Yunnan (mean ± standard deviation: 0.39 ± 0.26 °C (10 yr)−1), Tibet (0.22 ± 0.25 °C (10 yr)−1), Taiwan (0.21 ± 0.25 °C (10 yr)−1), and Sichuan (0.19 ± 0.25 °C (10 yr)−1). On the contrary, there is a cooling trend by 0.29 ± 0.26 °C (10 yr)−1 in northern China during the recent 15 yr, where a warming rate about 0.38 ± 0.11 °C (10 yr)−1 happened for 1960–2000. Overall, satellite simulation shows that the warming rate is reduced to −0.02 °C (10 yr)−1. The changes in underlying surface, Earth’s orbit, solar radiation and atmospheric counter radiation (USEOSRACR) cause China’s temperature rise about 0.02 °C (10 yr)−1. A combination of greenhouse gases (GHGs) and other natural forcing (ONAT, predominately volcanic activity, and atmosphere and ocean circulation) explain another part of temperature trend by approximately −0.04 °C (10 yr)−1. We conclude that there is a regional warming hiatus, a pause or a slowdown in China, and imply that GHGs-induced warming is suppressed by ONAT in the early 21st century.
Full paper (subscription required)
see also: China Met Office Confirms Global Warming Hiatus


[/FONT]

[FONT=&quot]
[/FONT]

 
Back
Top Bottom