• This is a political forum that is non-biased/non-partisan and treats every person's position on topics equally. This debate forum is not aligned to any political party. In today's politics, many ideas are split between and even within all the political parties. Often we find ourselves agreeing on one platform but some topics break our mold. We are here to discuss them in a civil political debate. If this is your first visit to our political forums, be sure to check out the RULES. Registering for debate politics is necessary before posting. Register today to participate - it's free!

The Solar Impact on Climate

I'll just point out that the MWP is really just a myth.

The definitive point here is made by the most comprehensive and largest paleoclimate study done to date, Pages 2k, which pretty clearly states:
"There were no globally synchronous multi-decadal warm or cold intervals that define a worldwide Medieval Warm Period or Little Ice Age, but all reconstructions show generally cold conditions between AD 1580 and 1880, punctuated in some regions by warm decades during the eighteenth century. The transition to these colder conditions occurred earlier in the Arctic, Europe and Asia than in North America or the Southern Hemisphere regions. Recent warming reversed the long-term cooling; during the period AD 1971–2000, the area-weighted average reconstructed temperature was higher than any other time in nearly 1,400 years."

Continental-scale temperature variability during the past two millennia : Nature Geoscience : Nature Research

A single study can't really be said to overturn half a dozen previous studies, unless you actually have the experience and qualifications necessary to make that assessment. That's always been the case, whatever one's opinion of the conclusion. Maybe the P2K conclusions will be validated by ongoing research, but going by the best and most comprehensive summary currently available, there seems to be more evidence favouring the MWP than not.

IPCC AR5 WG1 Figure 5.7:
Fig5-07.jpg
 
Last edited:
A single study can't really be said to overturn half a dozen previous studies, unless you actually have the experience and qualifications necessary to make that assessment. That's always been the case, whatever one's opinion of the conclusion. Maybe the P2K conclusions will be validated by ongoing research, but going by the best and most comprehensive summary currently available, there seems to be more evidence favouring the MWP than not.

IPCC AR5 WG1 Figure 5.7:
Fig5-07.jpg

Well, my understanding is that Pages 2k is pretty much the most comprehensive one out there, incorporating most of the other proxies used in many of the other studies.
 
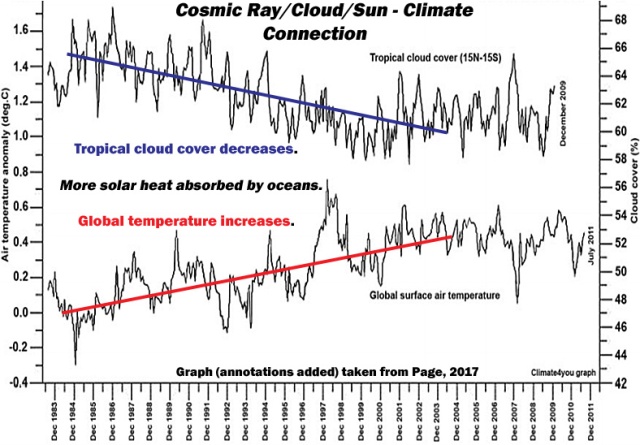
Cosmic Rays Increase Cloud Cover, Earth’s Surface Cools [link]

[h=2] Cosmic Rays Increase Cloud Cover, Earth’s Surface Cools[/h][FONT=&quot]Posted on March 24, 2017by Russ Steele[/FONT]

cooling-warming-temperature-cloud-page-17.jpg

A new scientific paper authored by seven scientists affiliated with the Russian Academy of Sciences was just published in the scientific journal Bulletin of the Russian Academy of Sciences: Physics.
The scientists dismiss both “greenhouse gases” and variations in the Sun’s irradiance as significant climate drivers, and instead embrace cloud cover variations — modulated by cosmic ray flux — as a dominant contributor to climate change.
A concise summary: As cosmic ray flux increases, more clouds are formed on a global scale. More global-scale cloud cover means more solar radiation is correspondingly blocked from reaching the Earth’s surface (oceans). With an increase in global cloud cover projected for the coming decades (using trend analysis), a global cooling is predicted.
– See more at: Russian Scientists Dismiss CO2 Forcing, Predict Decades Of Cooling, Connect Cosmic Ray Flux To Climate
 
With an increase in global cloud cover projected for the coming decades (using trend analysis), a global cooling is predicted.

So you are promoting a single untested model - sorry, a "trend analysis" predicting a complete reversal of the past half-century's trend - from 2017, rather than for example the family of models building on work from 1981 (Hansen et al), 1989 (Stouffer et al) and 1991 (IPCC) which have correctly projected not only the sign but with considerable accuracy both the magnitude and spatial distribution of global warming, and (from IPCC 2013) likewise accurately hindcasted over a century of global temperature variation.

I buy the occasional lottery ticket myself, so I'm no stranger to backing the long odds, but to openly promote this stuff without any kind of caveats or disclaimers?

This could end up being almost as embarrassing as that time you promoted the assertion that it's "impossible" for atmospheric CO2 increases to be a result of fossil fuel emissions. Almost.
 
Last edited:
So you are promoting a single untested model - sorry, a "trend analysis" predicting a complete reversal of the past half-century's trend - from 2017, rather than for example the family of models building on work from 1981 (Hansen et al), 1989 (Stouffer et al) and 1991 (IPCC) which have correctly projected not only the sign but with considerable accuracy both the magnitude and spatial distribution of global warming, and (from IPCC 2013) likewise accurately hindcasted over a century of global temperature variation.

I buy the occasional lottery ticket myself, so I'm no stranger to backing the long odds, but to openly promote this stuff without any kind of caveats or disclaimers?

This could end up being almost as embarrassing as that time you promoted the assertion that it's "impossible" for atmospheric CO2 increases to be a result of fossil fuel emissions. Almost.

For something to be embarrassing, the subject must be capable of being embarrassed.

Alas, that's clearly not what we are dealing with here.
 
So you are promoting a single untested model - sorry, a "trend analysis" predicting a complete reversal of the past half-century's trend - from 2017, rather than for example the family of models building on work from 1981 (Hansen et al), 1989 (Stouffer et al) and 1991 (IPCC) which have correctly projected not only the sign but with considerable accuracy both the magnitude and spatial distribution of global warming, and (from IPCC 2013) likewise accurately hindcasted over a century of global temperature variation.

I buy the occasional lottery ticket myself, so I'm no stranger to backing the long odds, but to openly promote this stuff without any kind of caveats or disclaimers?

This could end up being almost as embarrassing as that time you promoted the assertion that it's "impossible" for atmospheric CO2 increases to be a result of fossil fuel emissions. Almost.

We shall see.
[FONT=&quot]He had the calm confidence of a Christian with four aces.[/FONT]
[FONT=&quot]Mark Twain[/FONT]
 
So you are promoting a single untested model - sorry, a "trend analysis" predicting a complete reversal of the past half-century's trend - from 2017, rather than for example the family of models building on work from 1981 (Hansen et al), 1989 (Stouffer et al) and 1991 (IPCC) which have correctly projected not only the sign but with considerable accuracy both the magnitude and spatial distribution of global warming, and (from IPCC 2013) likewise accurately hindcasted over a century of global temperature variation.

I buy the occasional lottery ticket myself, so I'm no stranger to backing the long odds, but to openly promote this stuff without any kind of caveats or disclaimers?

This could end up being almost as embarrassing as that time you promoted the assertion that it's "impossible" for atmospheric CO2 increases to be a result of fossil fuel emissions. Almost.

I'm sure you can quote the post where I said it was impossible for atmospheric CO2 increases to be a result of fossil fuel emissions.
 
New Paper: 14 Scientists Affirm Solar Forcing, Not CO2, Is 'Dominant ...

notrickszone.com › 2017 › January › 23


Jan 23, 2017 - The authors assert that climate changes and solar activity are well .... (2017) paper (from Vieira et al., 2011, shown in this article's leading graph ..

. . . Climate scientist Dr. Jianyong Li, who has himself authored over 300 peer-reviewed scientific publications, continues this trend of linking climate changes to solar forcing. He and 13 other scientists just published a new paper in the journal Quaternary Science Reviews in which they have clearly affirmed the dominance of the Sun’s forcing on the climate of China (and for the Northern Hemisphere in general) during the past few thousand years, including the last century. The authors assert that climate changes and solar activity are well correlated throughout the paleoclimate record, and that if there is a role for greenhouse gases to influence climatic trends, that role is merely supplementary, not dominant. They also describe in detail how the Sun’s variance acts to influence atmospheric and oceanic heat oscillations, and how this may affect regional precipitation, weather, and temperature changes. - See more at: New Paper: 14 Scientists Affirm Solar Forcing, Not CO2, Is Dominant Control For Modern Climate Change . . . .
 
Yes, as I said it indicates A) a higher probability of a single year escaping the proxy limitations and B) the possibility that the lower average incorporating years before the late 90s may have been historically exceeded. Hence it's the past 15-20 years in particular which have a greater than 80% probability of exceeding medieval temperatures, since they have averaged above the 1996-2006 average.

Not sure why my pdf version screws up the spacing when I copy it, but here's a fuller quote if you're interested:
Another advantage of our method is that it allows us to calculate posterior probabilities of various scenarios of interest by simulation of alternative sample paths. For example, 1998 is generally considered to be the warmestyearonrecordintheNorthernHemisphere.Usingourmodel,we calculatethatthereisa36%posteriorprobabilitythat1998wasthewarmest yearoverthepastthousand.Ifweconsiderrollingdecades,1997-2006isthe warmestonrecord;ourmodelgivesan80%chancethatitwasthewarmest in the past thousand years. Finally, if we look at rolling thirty-year blocks, the posterior probability that the last thirty years (again, the warmest on record) were the warmest over the past thousand is 38%.​

I was already familiar with it - that's why I asked you what else it said because you didn't mention anything else.
In summary ...
In fact it actually tracked with the criticism of the original MBH by McIntyre and McKitrick (also statisticians).
That criticism being that Mann's approach then and again in 2008 was flawed in that if you choose the right data slices you can make a graph sing and dance.
GIGO.
Why? Essentially because using proxy data to reconstruct paleoclimate temperature is fraught with error (and charlatans as we keep seeing).
Further, how do we know this? Because using the same types of proxies as input to models developed using temperature readings, the models fail to recognize known past temperature variability.

And yes, you quoted the 80% chance earlier but neglected to mention the 38% figure using the author's model. We can only surmise why.
 
The point is that if factors other than CO2 are important in climate change the temperature increase between 1970 and 1998 are of no significance at all. They are the product of normal variation in climate plus some impact of CO2.

That means that the upper range of the IPCC's predictions are out.

So all the fuss goes away.

You may be wedded to your doom cult but the real world will safely ignore it.

Exactly right.
And that's why those other factors need to be minimized unless they can be boosted to show cooling when needed.
 
Scary jargon? LOL. It's a 'definition'. Look it up sometime.

List of pollutants vital to life?

Well, sure.

Most trace metals are essential to life- Chromium, Molybdenum, Arsenic, Lithium, Zinc, which are also classified as pollutants. I could probably lost ten more.

Nitric Oxide is a pollutant, yet one that is absolutely essential for life given its critical role in cellular signaling. But I wouldn't want to breathe it.

I can think of lots more, but this is probably enough, if not too much, for you to process.

Emission of anthropogenically created CO2 from fossil fuels is clearly leading to adverse environmental consequences, and therefore classifying it as a pollutant is appropriate, even in context of the wailing by yourself, Polgara and all the other deniers.

CO2 is a pollutant but not vital?
 
Russian Scientists Predict Global Cooling In The Next Few Decades [link]

[h=1]RUSSIAN SCIENTISTS PREDICT GLOBAL COOLING IN THE NEXT FEW DECADES[/h]
  • Date: 15/03/17
  • Global Warming Policy Forum
[h=2]In a new paper published by the Russian Academy of Sciences, seven senior scientists analysed the monthly average and annual average data of charged particle fluxes in the lower atmosphere, concluding that “a rise in the charged particle flux in the lower atmosphere in the next few years” would lead to “a decrease in the global temperature of the near-surface air layer.”[/h]
One of the most important problems facing humanity is finding the physical mechanism responsible for global climate change, particularly global warming on the Earth. Figure 1 presents the data on changes ΔT in the monthly average values of global temperature (averaged over the globe) in the near-surface air layer [1, 2]. The ΔТ values, shown as the fine curve, are counted from the average value of the global temperature acquired over the period 1901–2000. It can be seen that the changes in the ΔT values are irregular in character. A more or less smooth increase in temperature has been observed from around 1970 to the present. The thick curve represents calculations based on a spectral analysis of the monthly average data on ΔT for the period 1880–early 2016. The calculations show that the experimental data contain four main periodic components. Their characteristics (amplitude А in relative units; phase Ф and period P in years) are А1 = 0.406, Ф1 = 125.81, P1 = 204.57; А2 = 0.218, Ф2 = 31.02, P2 = 69.30; А3 = 0.079, Ф3 = 17.14, P3 = 34.58; and А4 = 0.088, Ф4 = 10.48, P4 = 22.61. The amplitudes of other spectral components with periods of less than 22 years are negligible. Summation of these periodicities for the future (after 2015) allows us to forecast the next few decades. The solid heavy line in Fig. 1 shows that cooling (a drop in ΔTvalues) is expected in the next few decades. The first harmonic А1 has the highest uncertainty in the considered method, due to the shortness of the series of ΔT values. [...] . . . .

I'm sure Putin will be pleased to hear of this.
 
I'm sure you can quote the post where I said it was impossible for atmospheric CO2 increases to be a result of fossil fuel emissions.

I already linked previously in this thread to where you promoted that view, in an opening post where you praised Murray Salby as "taking down the CO2 lobby":

Here's Murry Salby taking down the CO2 lobby. . . .


He states: “The premise of the IPCC that increased atmospheric CO2 results from fossil fuels emissions is impossible.”

Personally I would say it's impossible for your posts to have any credibility after that and numerous similar examples :lol:
 
Last edited:
Other factors being important doesn't just automatically reject CO2s influence. Math doesn't work that way.

I fully understand that.

I don't think you do.

If the warming between 1970 and 1998 was not due to human activity alone then what is the impact of such activity on the climate? It follows that it is problably less than that if you assume that all of the warming was down to CO2.

The result is that all the fuss goes away because the top end of the IPCC's predictions go away.
 
Hang on. This is a new goalpost.

No. The argument put forward by the alarmists is that we should be worried because the warming between 1978 and 1998 was unprecidented and massive and if you draw a line curving upwards to the ceiling from there it looks very scary!!!!!!!!

That this is a normal sort of temperature change and due to at least a very significant degree to natural factors makes the whole thing of no need to fuss.

Easy to understand.
 
No. The argument put forward by the alarmists is that we should be worried because the warming between 1978 and 1998 was unprecidented and massive and if you draw a line curving upwards to the ceiling from there it looks very scary!!!!!!!!

:roll: If you think that's a fair characterization of the climate change debate, there's nothing more to discuss here. If you'd like to discuss the actual argument like an adult, let me know.
 
:roll: If you think that's a fair characterization of the climate change debate, there's nothing more to discuss here. If you'd like to discuss the actual argument like an adult, let me know.

Well, OK tell me what the fuss is about!!

You will find that that is exactly the basis of the argument.
 

Well, OK tell me what the fuss is about!!

You will find that that is exactly the basis of the argument.
Thyy as much as say exactly that in this nature article.
Climate change: The case of the missing heat : Nature News & Comment
Stark contrast

On a chart of global atmospheric temperatures, the hiatus stands in stark contrast to the rapid warming of the two decades that preceded it. Simulations conducted in advance of the 2013–14 assessment from the Intergovernmental Panel on Climate Change (IPCC) suggest that the warming should have continued at an average rate of 0.21 °C per decade from 1998 to 2012. Instead, the observed warming during that period was just 0.04 °C per decade, as measured by the UK Met Office in Exeter and the Climatic Research Unit at the University of East Anglia in Norwich, UK.
I may not be into to the new math, but the two decades that precede 1998, is 1978 to 1998!
 
I already linked previously in this thread to where you promoted that view, in an opening post where you praised Murray Salby as "taking down the CO2 lobby":


Personally I would say it's impossible for your posts to have any credibility after that and numerous similar examples :lol:

It's a direct quote, and your assessment of my credibility is not of interest.
 

Well, OK tell me what the fuss is about!!

You will find that that is exactly the basis of the argument.

"Draw a line and it looks scary," as if someone just randomly drew a curve with a crayon based on no information. You know that's horse****, and until you can admit to it there's nothing to talk about.
 
So you are promoting a single untested model - sorry, a "trend analysis" predicting a complete reversal of the past half-century's trend - from 2017, rather than for example the family of models building on work from 1981 (Hansen et al), 1989 (Stouffer et al) and 1991 (IPCC) . . .

Got a theory that breaks a consensus? Expect aggressive silence. Snickering. Wait decades


For a long time it was thought the first people arrived in the Americas around 13,000 years ago. Jacques Cinq-Marc found a set of caves in the Yukon called the Bluefish Caves laden with bones marked with cuts from human butchering. They were radiocarbon dated as 24,000 years old. Cinq-Marcs published a series of papers between 1979-2001.
This is a topic that doesn’t have a $1.5 Trillion dollar industry riding on it. No political careers are made or broken if humans arrived in the Americas millenia earlier. Yet still, the smug scoffing of the consensus slowed progress in science for decades.
What Happens When an Archaeologist Challenges Mainstream Scientific Thinking?
Heather Pringer, Smithsonian.com
Cinq-Mars… work at Bluefish Caves suggested that Asian hunters roamed northern Yukon at least 11,000 years before the arrival of the Clovis people. And other research projects lent some support to the idea. At a small scattering of sites, from Meadowcroft in Pennsylvania to Monte Verde in Chile, archaeologists had unearthed hearths, stone tools and butchered animal remains that pointed to an earlier migration to the Americas. But rather than launching a major new search for more early evidence, the finds stirred fierce opposition and a bitter debate, “one of the most acrimonious—and unfruitful—in all of science,” noted the journal Nature.
But relatively few of Cinq-Mars’s peers shared his confidence. And as I began regularly attending archaeological conferences in the years following that trip to Bluefish Caves, I saw what Cinq-Mars was up against. Sitting in halls with Canadian and American researchers, I witnessed what happened when archaeologists presented data that contradicted the Clovis first model. Often a polite bemusement spread through the room, as if the audience was dealing with some crackpot uncle, or the atmosphere grew testy and tense as someone began grilling the presenter. But once or twice, the mask of professional respect slipped completely; I heard laughter and snickering in the room. Tom Dillehay remembers such conferences well. “Some Clovis first people had a suffocating air of defiance and superiority at times,” he says.
Stung as he was by the criticism, Cinq-Mars refused to back down. None of the explanations for splintered bones, he noted, could account for the complex chain of steps that produced the mammoth-bone flake tool his team found. But by then, serious doubts about the Bluefish Caves evidence had been sown, taking firm root in the archaeological community: Hardly anyone was listening. Cinq-Mars couldn’t believe it. At one presentation he gave, “they laughed at me,” he says angrily today. “They found me cute.” Embittered by the response, he stopped attending conferences, and gave up defending the site publicly. What was the point? To Cinq-Mars, the Clovis first supporters seemed almost brainwashed.
For Mackie and others, the protracted battle over the Clovis first model now stands as a cautionary tale for archaeologists. Notes Mackie, “Clovis first will, I believe, go down as a classic example of a paradigm shift, in which the evidence for the collapse of an old model is present for many years before it actually collapses, producing a sort of zombie model that won’t die.”
Keep reading →


"Draw a line and it looks scary," as if someone just randomly drew a curve with a crayon based on no information. You know that's horse****, and until you can admit to it there's nothing to talk about.

I think the line line was exactly that.

Show some sort of support for the idea that it was not.

That is exactly the point of the debate.
 
Back
Top Bottom