- Joined
- Jan 28, 2013
- Messages
- 94,823
- Reaction score
- 28,342
- Location
- Williamsburg, Virginia
- Gender
- Male
- Political Leaning
- Independent
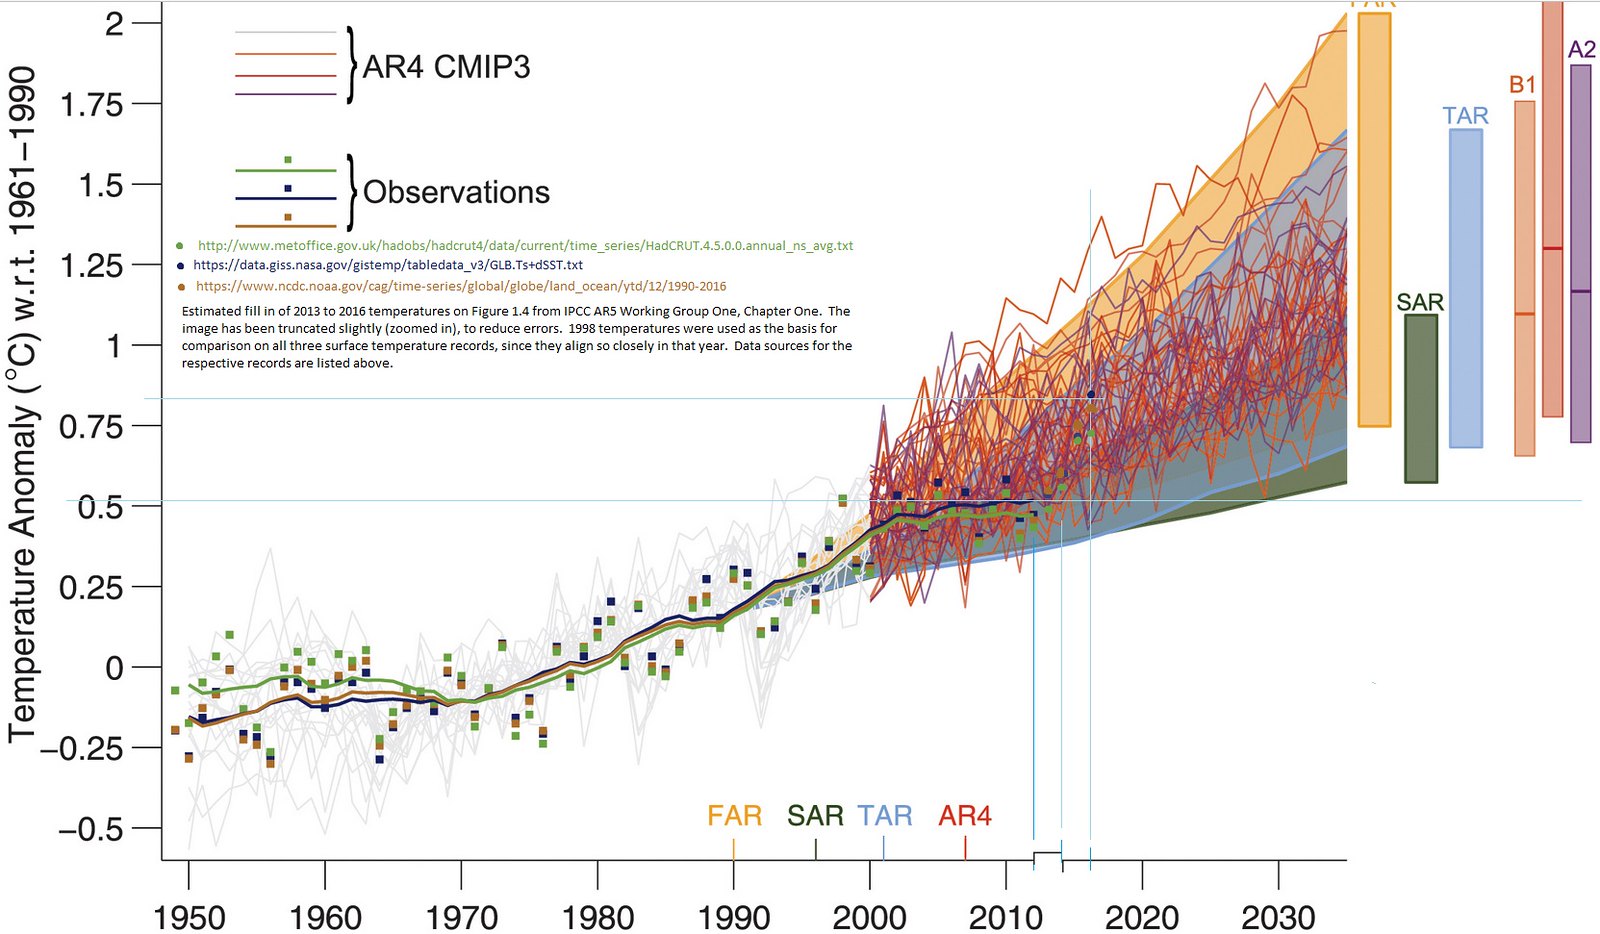
This is Judith Curry's take on climate models. Not surprisingly she's not impressed. Without the GCM's how much of the AGW message remains?
Climate models for the layman
Posted on 21 Feb 17 by PAUL MATTHEWS • 2 Comments
Judith Curry has written a new paper, Climate models for the layman, published today by the GWPF. She hasn’t done a blog post about it, nor has anyone else as far as I can see, so here’s a venue to discuss it. The aim is “to describe the debate surrounding GCMs to an educated but … Continue reading →
Judith Curry has written a new paper, Climate models for the layman, published today by the GWPF.
She hasn’t done a blog post about it, nor has anyone else as far as I can see, so here’s a venue to discuss it.
The aim is “to describe the debate surrounding GCMs to an educated but nontechnical audience”.
Here are the key points from the summary:
- GCMs have not been subject to the rigorous verification and validation that is
the norm for engineering and regulatory science. - There are valid concerns about a fundamental lack of predictability in the complex
nonlinear climate system. - There are numerous arguments supporting the conclusion that climate models
are not fit for the purpose of identifying with high confidence the proportion
of the 20th century warming that was human-caused as opposed to natural. - There is growing evidence that climate models predict too much warming from
increased atmospheric carbon dioxide. - The climate model simulation results for the 21st century reported by the Intergovernmental
Panel on Climate Change (IPCC) do not include key elements
of climate variability, and hence are not useful as projections for how the 21st
century climate will actually evolve. . . .