
- Joined
- Jan 28, 2013
- Messages
- 94,823
- Reaction score
- 28,342
- Location
- Williamsburg, Virginia
- Gender
- Male
- Political Leaning
- Independent
File this under "propaganda claim meets data." Hint: data wins. It's always fun when "common knowledge" turns out to be merely widespread error.
On the Decrease of Hot Days in the US
Posted on December 16, 2016 | 66 comments
by Turbulent Eddie
Adjusted USHCN data indicate a decrease in CONUS hot days TMAX >= 100°F
Continue reading →
Adjusted USHCN data indicate a decrease in CONUS hot days TMAX >= 100°F
As part of his 2016 testimony to Congress, Dr. John Christy presented this chart:

Figure 1. The average number of 100°F days in the USHCN data set from Christy.
This result evoked some amount of discussion on climate related blogs. After initially reproducing a similar result, I considered some of the blog comments which questioned raw versus adjusted data, station moves and how global records might compare. I examined these issues and the results follow. . . .
What doesn’t this analysis mean?
This does not mean that global warming is not occurring. The trend for spatially weighted CONUS annual TMAX data (not just hot days) indicates a positive trend which is roughly consistent with other assessments of the global warming trend of the last century.
This also does not indicate a trend of decreasing hot days. The past variance (standard deviation 70% of the mean occurrence of hot days) is high and could impose a variety of trends.
What does this analysis mean?
What this means is that the assumption that global warming has led to more frequent hot days in the US is incorrect. Before examining the data, I would have agreed with probably most Americans in assuming that we have experienced more hot days than our ancestors did. Observations indicate just the opposite: our ancestors experienced more hot days the we have.
Also what this means is that the confidence expressed by the IPCC may be unwarranted when they write that for the next century “Warmer and/or more frequent hot days and nights over most land areas are virtually certain”.
On the Decrease of Hot Days in the US
Posted on December 16, 2016 | 66 comments
by Turbulent Eddie
Adjusted USHCN data indicate a decrease in CONUS hot days TMAX >= 100°F
Continue reading →
Adjusted USHCN data indicate a decrease in CONUS hot days TMAX >= 100°F
As part of his 2016 testimony to Congress, Dr. John Christy presented this chart:
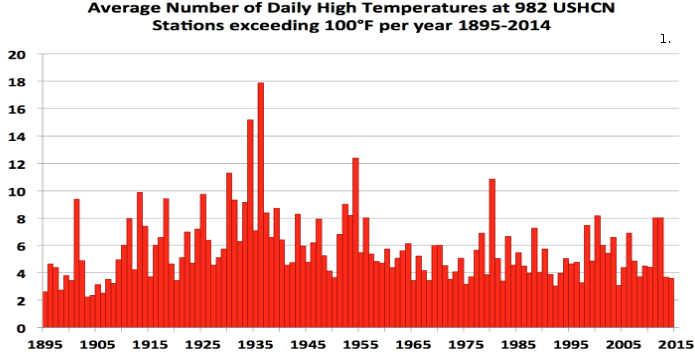
Figure 1. The average number of 100°F days in the USHCN data set from Christy.
This result evoked some amount of discussion on climate related blogs. After initially reproducing a similar result, I considered some of the blog comments which questioned raw versus adjusted data, station moves and how global records might compare. I examined these issues and the results follow. . . .
What doesn’t this analysis mean?
This does not mean that global warming is not occurring. The trend for spatially weighted CONUS annual TMAX data (not just hot days) indicates a positive trend which is roughly consistent with other assessments of the global warming trend of the last century.
This also does not indicate a trend of decreasing hot days. The past variance (standard deviation 70% of the mean occurrence of hot days) is high and could impose a variety of trends.
What does this analysis mean?
What this means is that the assumption that global warming has led to more frequent hot days in the US is incorrect. Before examining the data, I would have agreed with probably most Americans in assuming that we have experienced more hot days than our ancestors did. Observations indicate just the opposite: our ancestors experienced more hot days the we have.
Also what this means is that the confidence expressed by the IPCC may be unwarranted when they write that for the next century “Warmer and/or more frequent hot days and nights over most land areas are virtually certain”.
")

