• This is a political forum that is non-biased/non-partisan and treats every person's position on topics equally. This debate forum is not aligned to any political party. In today's politics, many ideas are split between and even within all the political parties. Often we find ourselves agreeing on one platform but some topics break our mold. We are here to discuss them in a civil political debate. If this is your first visit to our political forums, be sure to check out the RULES. Registering for debate politics is necessary before posting. Register today to participate - it's free!

Sixteen Warmest Years (1880–2015) ALL 1998-2015

Lying again I see.
I already asked, l and you FAILED to show what parts of his post I didn't answer.
See my #16.

I answered all of them, including the "1880" and (pre-1880) "Climate" part I just Re-Busted You on.
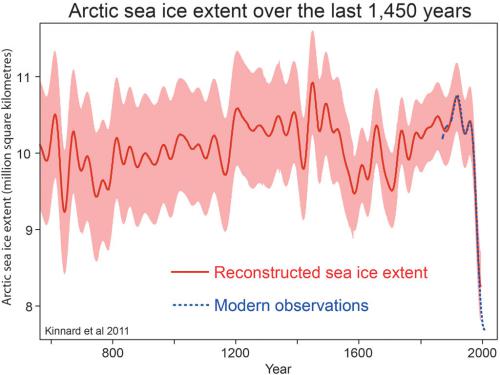
Jack (and now-vanished Fletch prior) had Dishonestly Ignored the fact I had put up two charts of 1400 year old Sea Ice records.

Normally I wouldn't answer these Clownish, necessarily under 10-worders from Jack, but hey, the topic/headline alone Hurts the other side, so I'll play.

From your #16, in response to a question about why all posted temperature series started in 1880:

Because that's when they started keeping Yearly Climate records?

QED.
 
From your #16, in response to a question about why all posted temperature series started in 1880:

Because that's when they started keeping Yearly Climate records?
QED.
LYING again I see.

That's NOT the question/he asked/I answered.
As I explained/elaborated at the bottom of the last page

mbig #20 said:
..It was NOT about "Climate records" in general. "1880", AGAIN, has to do with the beginning of the National Weather Service and much more accurate numbers.

And I also posted two charts of 1400 Years of Sea Ice (Fletch Ignored, Now YOU), so OBVIOUSLY I understood there are older "records".
DUH!

....
Incredible how juvenile your last-wording is considering your claims of of former position.. unless that's WHY you're here now instead.

may use Jack's next last-word (last 10 words or less usually) for future bumping of this string.
 
Last edited:
LYING again I see.

That's NOT the question/he asked/I answered.
As I explained/elaborated at the bottom of the last page

Incredible how juvenile your last-wording is considering your claims of of former position.. unless that's WHY you're here now instead.
bye

may use Jack's next last-word (last 10 words or less usually) for future bumping of this string.

I merely quoted you. If you're uncomfortable with your own words that's not a problem I can help you with. And all that anger isn't healthy.
 
NASA.gov - July 19, 2016
2016 Climate Trends Continue to Break Records
https://www.nasa.gov/feature/goddard/2016/climate-trends-continue-to-break-records

Two key climate change indicators -- global surface temperatures and Arctic sea ice extent -- have Broken numerous Records through the first half of 2016, according to NASA analyses of ground-based observations and satellite data.

Each of the first Six months of 2016 set a Record as the Warmest respective month globally in the modern temperature record, which dates to 1880, according to scientists at NASA's Goddard Institute for Space Studies (GISS) in New York. The six-month period from January to June was also the planet's warmest half-year on record, with an average temperature 1.3 degrees Celsius (2.4 degrees Fahrenheit) warmer than the late 19th century.

Five of the first six months of 2016 also set records for the smallest respective monthly Arctic sea ice extent since consistent satellite records began in 1979, according to analyses developed by scientists at NASA's Goddard Space Flight Center, in Greenbelt, Maryland. The one exception, March, recorded the second smallest extent for that month.

While these two key climate indicators have broken records in 2016, NASA scientists said it is more significant that global temperature and Arctic sea ice are continuing their decades-long trends of change. Both trends are ultimately driven by Rising Concentrations of heat-trapping Carbon Dioxide and other Greenhouse gases in the atmosphere.

The extent of Arctic sea ice at the peak of the summer melt season now typically covers 40% less area than it did in the late 1970s and early 1980s. Arctic sea ice extent in September, the seasonal low point in the annual cycle, has been declining at a rate of 13.4% per decade.
[.......]​

Please see my #10.
 
Then you Really should have obejected to LowDown's ONE YEAR ANECDOTE (1922) OP.
....as "historical record"!
http://www.debatepolitics.com/envir...749-historical-records-arctic-ice-extent.html
What Disingenuous Garbage!
I guess you missed it.

And of course "135 Years" closely Mirrors the Industrial Revolution/Emissions.
Coincidence?

Oh, and have 10x that period!

Kinnard_2011_sea_ice_med.jpg


Sciam
naam-ice-031.jpg


Extreme Hockey Stick is Glaring.

Another one of your sea ice threads?
Good grief.
With another hockey stick reference to boot (word choice intentional).
And your same problem holds as the last time I mentioned it and you couldn't answer it.
Appending modern observations/satellite measurements to reconstructed data is inherently problematic.
Added to that perpetual problem, we see the huge error band on a graph already cursed with what has been seen as built using questionable methodology resulting questionable conclusions.
Yes, you may be thinking that sounds like the hockey stick and it does, so in that sense, and only in that sense, you're right.
 
UNCATEGORIZED
Vilifying Rose – a Tale of Two Standards

Posted on 03 Dec 16 by JAIME JESSOP 16 Comments
In the Mail on Sunday last week, David Rose penned an article pointing out the very sharp decline in RSS land only data to October 2016, indicating that ocean surface temperatures might also cool significantly soon and that perhaps scientists and the media over-played the role of man-made global warming in the spike in global …

In the Mail on Sunday last week, David Rose penned an article pointing out the very sharp decline in RSS land only data to October 2016, indicating that ocean surface temperatures might also cool significantly soon and that perhaps scientists and the media over-played the role of man-made global warming in the spike in global temperatures in early 2016 which were precipitated by the natural warming event of El Nino 2015/16. Predictably, he has been vilified for doing so, called a denier, accused of cherry-picking the data to suit his ‘denialist’ agenda etc. etc. All pretty familiar stuff now to those used to observing the spectacle which is warmist kick-back against any who dare to question any aspect of ‘The Science’.James Delingpole then joined the fray and published at Breitbart, referencing Rose’s article, pointing out the “icy silence” from climate alarmists following the large drop in land temperatures (as measured by RSS satellite but also, as it happens, by GISS and UAH). Warmist fury peaked El Nino-like when the House of Representatives Committee on Science, Space & Technology had the audacity to tweet a link to Delingpole the Denier’s Breitbart article. Cue rants from the Keepers of the True Science of Climate Change and numerous other lesser warmist offendotron minions.The main objection to Rose’s article is that he ‘cherry-picked’ land only data from the RSS lower troposphere dataset and ignored the oceans (he did not) and that (bizarrely) he cherry-picked two data points and ignored the longer record. The whole point of Rose’s article is that this is exactly what the media and scientactivists were doing when they hyped the El Nino to promote the anthropogenic global warming message! And they did. There is no doubt about that (as we shall see). . . .


Because that's when they started keeping Yearly Climate records?
DOH!
Great. So that means there is no accurate measure of global temps prior to 1880, yet you somehow pulled a 1400 year chart out of your arse.
DOH!

And you could Not have missed the TWO "1400 Year" Charts, so you DISHONESTLY Ignored them.
DOH!
Addressed above


I love the old Goofy/DISHONEST Burden-Shift Fallacy.
I do Not have to tell you how to Cure Lung Cancer, just because I tell you (and we know) smoking contributes to it.
DOH!
Nothing 'goofy/dishonest about it. The simple truth is, I asked you a question that you cant answer. No need to get all pissy and bitter about it. Perhaps you might grow up a little rather than post angry, juvenile responses.
 
Climate News
[h=1]New website provides strong evidence of the recent warming slowdown[/h]Guest essay by Sheldon Walker A new website has been created, which offers a new perspective on global warming. The website is called “mta-graphs.com” Temperature series like Gistemp or UAH, are turned into 2 dimensional coloured graphs, called global warming contour maps. A contour map is basically a colour coded collection of thousands of linear…
 
With the last Two, and 3 of 4, the HOTTEST.
2015 beating 2014 by even more than previous incremental jumps.
And all but one in this century.
and yet we read about a/another "PAUSE" in one Deluded Climate-denier-Blog string.
WTF!
and 2016 is on course to BUST the last few.

NOAA
Sixteen Warmest Years (1880–2015)
https://www.ncdc.noaa.gov/sotc/global/201513

Anomaly charts With Degree Differentials/Anomalies can be see at website above or at
https://en.wikipedia.org/wiki/Instrumental_temperature_record#Warmest_periods

1 - -- - 2015
2 - -- - 2014
3 -- - - 2010
4 - -- - 2013
5 - - -- 2005
6 (tie) 1998
6 (tie) 2009
8 - -- - 2012
9 (tie) 2003
9 (tie) 2006
9 (tie) 2007
12 - - - 2002
13 (tie) 2004
13 (tie) 2011
15 (tie) 2001
15 (tie) 2008

The hottest years used to be in the 1930s until they started fudging the data at GISS. Here's what NASA published before 2000:

temperature record prior to 2000.JPG

And since then they have been revising old data apparently to send the higher temps in the 1930s down the memory hole and to exaggerate recent warming. (Yes, I do indeed believe that they are just that corrupt.) But data at NOAA still shows that heat waves seen in the 1930s were the worst in history.
 
Another one of your sea ice threads?
Good grief.
With another hockey stick reference to boot (word choice intentional).
And your same problem holds as the last time I mentioned it and you couldn't answer it.
Appending modern observations/satellite measurements to reconstructed data is inherently problematic.
Added to that perpetual problem, we see the huge error band on a graph already cursed with what has been seen as built using questionable methodology resulting questionable conclusions.
Yes, you may be thinking that sounds like the hockey stick and it does, so in that sense, and only in that sense, you're right.

These reconstructions are bogus. Historical records show that ice extent was even less than it is now from time to time, but where are these dips in ice coverage in these reconstructions?

Data Reconstructions from alarmists are worse than no data at all.
 
The hottest years used to be in the 1930s until they started fudging the data at GISS. Here's what NASA published before 2000:

View attachment 67210772

And since then they have been revising old data apparently to send the higher temps in the 1930s down the memory hole and to exaggerate recent warming. (Yes, I do indeed believe that they are just that corrupt.) But data at NOAA still shows that heat waves seen in the 1930s were the worst in history.

The warmers will not agree with you. I've been down this road before. They will maintain the corrections are correct.

They are faithful to the dogma.
 
These reconstructions are bogus. Historical records show that ice extent was even less than it is now from time to time, but where are these dips in ice coverage in these reconstructions?

Data Reconstructions from alarmists are worse than no data at all.

There are no dips because the reconstruction samples cover more years than these cycles. The peaks and valleys disappear because the proxy resolution isn't high enough.
 
There are no dips because the reconstruction samples cover more years than these cycles. The peaks and valleys disappear because the proxy resolution isn't high enough.

If that were true we wouldn't see the current dip in coverage in that graph either.
 
If that were true we wouldn't see the current dip in coverage in that graph either.

The newer the proxy, the higher the resolution. Old proxies generally span a minimum of 120 years, and many used average over 600 years.
 
These reconstructions are bogus. Historical records show that ice extent was even less than it is now from time to time, but where are these dips in ice coverage in these reconstructions?

Data Reconstructions from alarmists are worse than no data at all.

Of course.
I expect soon they'll be making graphs using data from non-contiguous time periods for greater effect.
 
If that were true we wouldn't see the current dip in coverage in that graph either.
I think they tie different types of proxies on the end on the record,
Like Mike's nature trick.
I’ve just completed Mike’s Nature trick of adding in the real temps to each series for the last 20 years
To some it is difficult to conceive how mixing a 120 year proxy, with a daily proxy, might cause a
linearity problem.
 
Climate News
[h=1]Despite Denial, Data Shows Global Temperatures Are Dropping Fast[/h]All global temperature data sets confirm that global temperature has fallen rapidly in recent months as the recent El Nino ended. Guest essay by Dr David Whitehouse, The GWPF Science Editor Over the last couple of years there have been many articles about how they have been record-breakers in global temperature. It’s often sold as…
Using the WUWT Thermo-momeleter maybe.
2016 will be ANOTHER Record WarmEST year.
Duhf course there will be 'months' (even years) when things vary. Nothing goes straight up, nor is predicted to.

The usual: not even a word of your own, just a a cut-paste denier Blog-as-scripture. (WUWT)
Thx for the bump..

The data speaks for itself.
 
Using the WUWT Thermo-momeleter maybe.
2016 will be ANOTHER Record WarmEST year.
Duhf course there will be 'months' (even years) when things vary. Nothing goes straight up, nor is predicted to.

The usual: not even a word of your own, just a a cut-paste denier Blog-as-scripture. (WUWT)
Thx for the bump..

I'm not concerned about the warmest year or not. I'm concerned with the chronic record adjustments and land use change influence on meteorological equipment. It's very hard to get accurate measurements in a world where the integrity of the equipment and methods are rightfully questioned.
 
SATURDAY, DECEMBER 3, 2016
HotWhopper: Hottest November on record for the troposphere - with a comment on Trumped Up Courage
Hottest November on record for the troposphere - with a comment on Trumped Up Courage

Despite what David Rose, the Global Warming Policy Foundation, the fake press (Breitbart), WUWT, and the US House Science Committee will try to claim - global warming is real and happening now. There is no ice age about to arrive.

For the troposphere, November was the hottest November on record!
The troposphere temperatures for November 2016 have been released. The lower troposphere is recorded in UAH v6 beta 5 and RSS TLT v3.3. This report also covers RSS TTT for the troposphere (without the "lower") and follows pretty much the same format as previous monthly updates.

For RSS TTT (troposphere), last month was the hottest November on record. For 2016 to be colder than the previous hottest year (1998), the troposphere would have to average a negative anomaly:- less than -1.57 °C for the remaining month. It's an understatement to say that is unlikely.
[......]​
It is interesting to watch people splitting hairs trying to suggest record temperatures are continuing.
The TTT includes a broader section of the troposphere, and is not the normal TLT that is compared to the surface temperatures.
Within the TLT, November was nothing special.
http://data.remss.com/msu/graphics/TLT/time_series/RSS_TS_channel_TLT_Global_Land_And_Sea_v03_3.txt
I guess they could have selected the TLT from UAH, it actually had a record November,
http://www.nsstc.uah.edu/data/msu/v6.0beta/tlt/uahncdc_lt_6.0beta5.txt
The GISS will be out in a few days, what do you think higher or lower then the earlier Novembers?
In all reality, the troposphere probably is getting hotter. However, the heat the atmosphere holds is inconsequential to the heat the oceans hold. It also appears we have an approximate 40 year natural climate cycle. Who knows what will happen next.
 
In all reality, the troposphere probably is getting hotter. However, the heat the atmosphere holds is inconsequential to the heat the oceans hold. It also appears we have an approximate 40 year natural climate cycle. Who knows what will happen next.
I agree, I was just pointing out how strange it was for someone to start talking about TTT channel, when most of the references
discuss the TLT. I guess they needed to select the data source that supported their statement!
 
Back
Top Bottom