• This is a political forum that is non-biased/non-partisan and treats every person's position on topics equally. This debate forum is not aligned to any political party. In today's politics, many ideas are split between and even within all the political parties. Often we find ourselves agreeing on one platform but some topics break our mold. We are here to discuss them in a civil political debate. If this is your first visit to our political forums, be sure to check out the RULES. Registering for debate politics is necessary before posting. Register today to participate - it's free!

How much does El Nino affect global temperatures?

Playing fast and loose with the facts, yet again? Barely two weeks ago you yourself posted a study showing that in the period 1960-2009, Tmin globally had increased by only about 30% more than Tmax.

That's 1.3 to 1, not 3 to 1; and as I've pointed out for even later data the ratio may be as low as 1.1 to 1. I'm sure you were just confused however.
I think you misunderstood what the Davy paper was.
 
Most of us don't need a lesson/propaganda page.

Droughts are simply worse in recent years than the 30's, only because we are using more water. Not because of climate.

I gave a document that was extensively footnoted with peer-reviewed scientific papers. Your reply seemed to be just your opinion. Do you have anything showing some research on the subject?
 
I gave a document that was extensively footnoted with peer-reviewed scientific papers. Your reply seemed to be just your opinion. Do you have anything showing some research on the subject?

Not easily accessible. I would have to look for it again. I have looked into this in the past. There is no significant difference in rainfall from past severe droughts, to today. For water accumulating into lakes, streams, rivers, etc... we have a significant difference now in how much water is channeled into storm sewers vs. what would remain in the ground. And please don't try to say we don't use more water today than in the past.

Maybe a year or two ago. Maybe longer, there was something about Folsom Lake, and other reservoirs. The modern records even showed it, and others, not to be record lows in level, but the pundits spun it that way. Of course, water restrictions were tighter because of increased demands. The people relying on water were impacted harder than the past, but again, because of a greater demand for a limited supply.
 
Did you not read my post? I said "So I agree night times are warming more, but I don't see the records showing the warming is ONLY happening at night and in the winter."
Nor did I say it was only warming in the winter evenings, Hint when someone talks about a ratio
it means something in relationship to another so a ratio of 3:1 for nighttime warming in relationship to daytime warming,
means the nighttime warmed by say .75 and the daytime by .25, I.E 3:1.
 
I think you misunderstood what the Davy paper was.

You may think that, but you would be wrong. The paper itself explicitly notes that:

The global decrease in the DTR during the latter half of the 20th century has been documented in the literature (Karl et al., 1984). Later, this distinct pattern was discovered in both global and regional temperature records (Karl et al., 1993). However, there has been some degree of temporal variation in the rate of change of the DTR, with some evidence of a slowing or even reversal of the negative trend in recent decades (Hartmann et al., 2013).​

From Hartmann et al 2013 (IPCC AR5 WG1 Ch. 2):

No dedicated global analysis of DTR has been undertaken subsequent to Vose et al. (2005a), although global behaviour has been discussed in two broader ranging analyses. Rohde et al. (2012) and Wild et al. (2007) note an apparent reversal since the mid-1980s; with DTR subsequently increasing. This decline and subsequent increase in DTR over global land surfaces is qualitatively consistent with the dimming and subsequent brightening noted in Section 2.3.3.1.​

Vose et al 2005 is also directly cited in Table 1 of the Davy paper; showing a -0.07C/decade trend in DTR from 1950-2004 (in case you're wondering that's a 1.43 to 1 ratio from even marginally newer data, again obviously a far cry from your claim that it's still 3 to 1), and a zero trend in DTR from 1979-2004 (or more precisely, a 1.03 to 1 ratio).
ftp://ftp.ncdc.noaa.gov/pub/data/papers/200686amsp4.1rvfree.pdf
Both maximum and minimum temperature increases from 1979-2004 whereas the DTR is basically trendless. The maximum and minimum temperature trends are nearly identical (0.287 versus 0.295°C dec-1), and both are comparable to the mean temperature trend over global land areas for the period (0.296 °C dec-1) as derived from the Global Historical Climatology Network database (J. Lawrimore, pers. comm., 2005). Given the similarity between maximum and minimum temperature, the trend in the DTR (-0.001 °C dec-1) is not statistically significant at the 5% level.​

Less than three weeks ago you personally referenced a paper which itself shows a 1.29 to 1 ratio of Tmin to Tmax change (1960-2009) and cites two other sources suggesting even smaller ratios since 1979. I've pointed this out myself twice now, and added yet another paper confirming that fact. But you're just going to go ahead and stick with your claim that there is still a 3 to 1 ratio of night to daytime warming :roll:

Guess Threegoofs was wrong that it would take you a month to 'forget' - you'll just flat out refuse to accept the evidence which you yourself presented.
 
Last edited:
You may think that, but you would be wrong. The paper itself explicitly notes that:

The global decrease in the DTR during the latter half of the 20th century has been documented in the literature (Karl et al., 1984). Later, this distinct pattern was discovered in both global and regional temperature records (Karl et al., 1993). However, there has been some degree of temporal variation in the rate of change of the DTR, with some evidence of a slowing or even reversal of the negative trend in recent decades (Hartmann et al., 2013).​

From Hartmann et al 2013 (IPCC AR5 WG1 Ch. 2):

No dedicated global analysis of DTR has been undertaken subsequent to Vose et al. (2005a), although global behaviour has been discussed in two broader ranging analyses. Rohde et al. (2012) and Wild et al. (2007) note an apparent reversal since the mid-1980s; with DTR subsequently increasing. This decline and subsequent increase in DTR over global land surfaces is qualitatively consistent with the dimming and subsequent brightening noted in Section 2.3.3.1.​

Vose et al 2005 is also directly cited in Table 1 of the Davy paper; showing a -0.07C/decade trend in DTR from 1950-2004 (in case you're wondering that's a 1.43 to 1 ratio from even marginally newer data, again obviously a far cry from your claim that it's still 3 to 1), and a zero trend in DTR from 1979-2004 (or more precisely, a 1.03 to 1 ratio).
ftp://ftp.ncdc.noaa.gov/pub/data/papers/200686amsp4.1rvfree.pdf
Both maximum and minimum temperature increases from 1979-2004 whereas the DTR is basically trendless. The maximum and minimum temperature trends are nearly identical (0.287 versus 0.295°C dec-1), and both are comparable to the mean temperature trend over global land areas for the period (0.296 °C dec-1) as derived from the Global Historical Climatology Network database (J. Lawrimore, pers. comm., 2005). Given the similarity between maximum and minimum temperature, the trend in the DTR (-0.001 °C dec-1) is not statistically significant at the 5% level.​

Less than three weeks ago you personally referenced a paper which itself shows a 1.29 to 1 ratio of Tmin to Tmax change (1960-2009) and cites two other sources suggesting even smaller ratios since 1979. I've pointed this out myself twice now, and added yet another paper confirming that fact. But you're just going to go ahead and stick with your claim that there is still a 3 to 1 ratio of night to daytime warming :roll:

Guess Threegoofs was wrong that it would take you a month to 'forget' - you'll just flat out refuse to accept the evidence which you yourself presented.
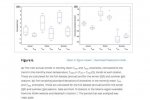
The Davy paper, was a comparison of many of the papers out there about diurnal asymmetry, in making the comparison, they quote and cite the various papers.
It does not mean those are their findings. The diurnal and seasonal asymmetry, was noted in 1895, so it has been around for a while.
What I found interesting about Davy was long graph.
Davy_fig6.jpg
As to Vose, here was the comment after attached to Vose after the numbers you described,
DTR change is smaller after 1979 but strong increase in Tmin in wintertime continues
 
Last edited:
Nor did I say it was only warming in the winter evenings, Hint when someone talks about a ratio
it means something in relationship to another so a ratio of 3:1 for nighttime warming in relationship to daytime warming,
means the nighttime warmed by say .75 and the daytime by .25, I.E 3:1.

No what you DID say was "You may disagree that the nights are warming more, but you would be wrong." I was pointing out that I said the opposite and what you posted about what I said was incorrect.
 
Did you not read my post? I said "So I agree night times are warming more, but I don't see the records showing the warming is ONLY happening at night and in the winter."
You are looking at the wrong records, For nighttime they usually talk about the lows, If the T-Min is increasing,
or course there are not as many lows.
Lets say the normal Feb evening in the midwest gets down to 5 F(-15C), and now it only gets down to 7 degrees F -13.88C.
The normal daytime high in the same area in Feb is 35 F(1.66 C) has increased to 35.5 F(1.944 C)
The average temperature has increased by (1.12 + .28)/2= .7 C.
Has the average daily temperature increased? absolutely, but the majority of the increase was the nighttime not getting as cold as
it normally would, records are usually the upper and lower margins, they don't really talk about the middle margins much.

And for the third time, I am agreeing with you. Why do you not read my post.
 
Tropical Hot spot
Study: Tropical Hotspot ‘Fingerprint’ Of Global Warming Doesn’t Exist In The Real World Data

One of the main lines of evidence used by the Obama administration to justify its global warming regulations doesn’t exist in the real world, according to a new report by climate researchers. Guest essay by Michael Bastasch, reprinted with permission Researchers analyzed temperature observations from satellites, weather balloons, weather stations and buoys and found the…

Researchers analyzed temperature observations from satellites, weather balloons, weather stations and buoys and found the so-called “tropical hotspot” relied upon by the EPA to declare carbon dioxide a pollutant “simply does not exist in the real world.”
They found that once El Ninos are taken into account, “there is no ‘record setting’ warming to be concerned about.”
“These analysis results would appear to leave very, very little doubt but that EPA’s claim of a Tropical Hot Spot (THS), caused by rising atmospheric CO2 levels, simply does not exist in the real world,” reads the report by economist James Wallace, climatologist John Christy and meteorologist Joseph D’Aleo.
“Also critically important, even on an all-other-things-equal basis, this analysis failed to find that the steadily rising atmospheric CO2 concentrations have had a statistically significant impact on any of the 13 critically important temperature time series analyzed,” they wrote. . . .


On of the papers I read recently says the tropics are part of the globe only insignificantly affected by CO2 changes. The reason is the humidity is already so high at the near surface, that the H2O already has dominated temperatures cause by radiative forcing.
 
Back
Top Bottom