- Joined
- Jun 3, 2009
- Messages
- 30,870
- Reaction score
- 4,246
- Gender
- Male
- Political Leaning
- Very Conservative
For years now people have been complaining about the CPI, that the inflation that they are experiencing is not adequately captured by the measure. I want to show in a few simple graphs why that is the case.
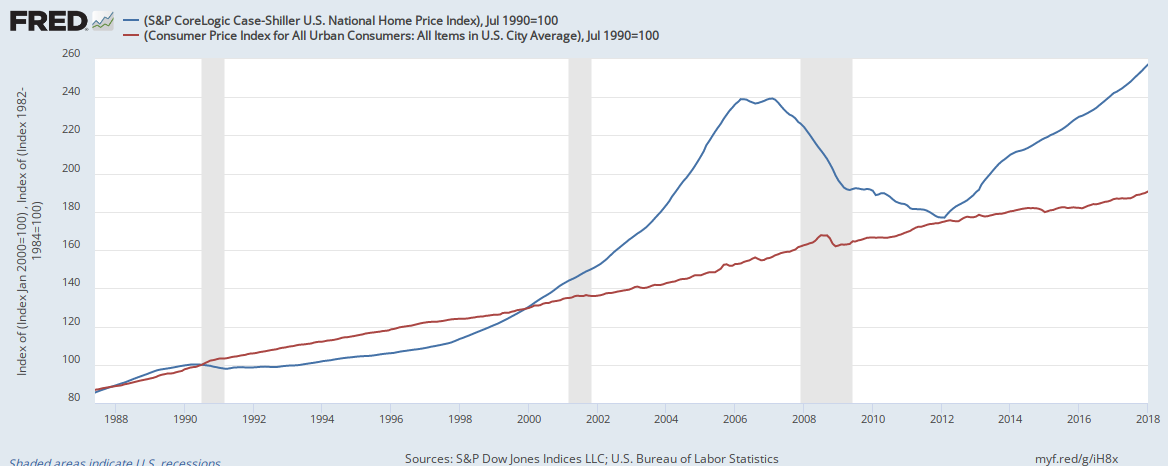
Here I have plotted the Case-Shiller National Home Price Index along with CPI, where both are indexed to be equal in 1990. What we see is that the growth in home prices has wildly outpaced CPI. In fact, home prices are about 33% higher than where CPI would expect them to be.
But CPI is weighted to represent how much people spend on certain items. Thus, around 40% of CPI is weighted toward housing. So why is CPI not capturing this? Because instead of just using home values, they use something called Owners' Equivalent Rent of Residence:
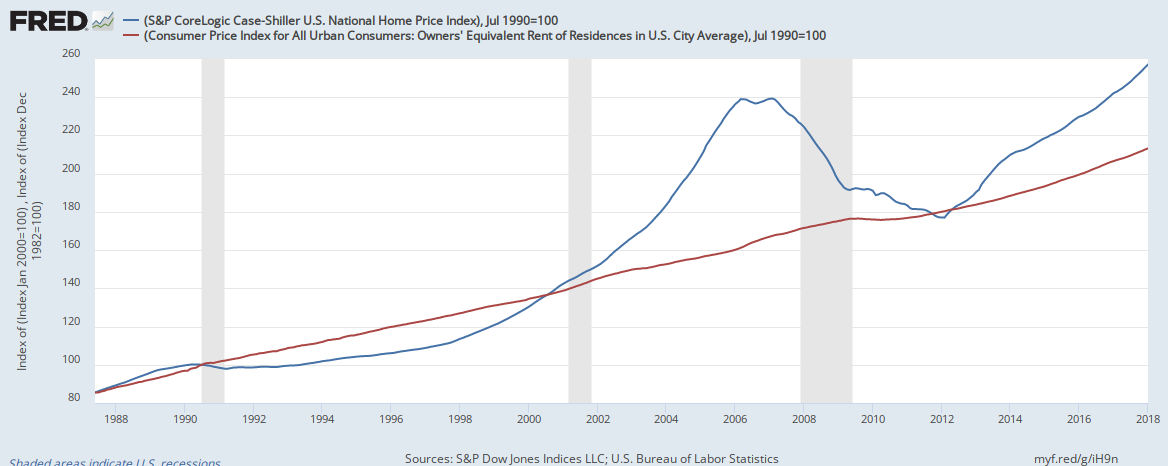
Look at that graph and you tell me how you think this measure has performed.
I thought that this would be interesting to talk about, and problems like this cause many Americans to ignore economic measures because they do not reflect the reality that they face.
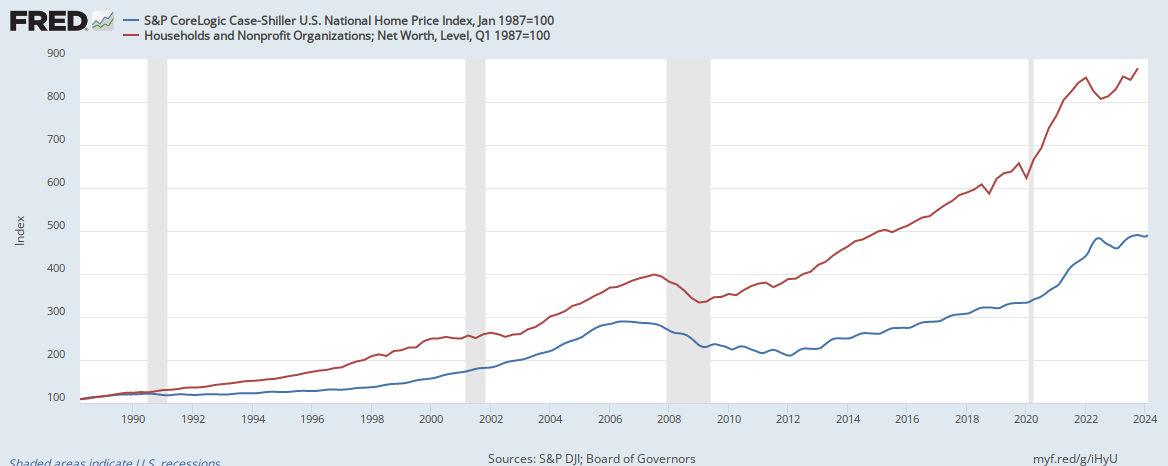
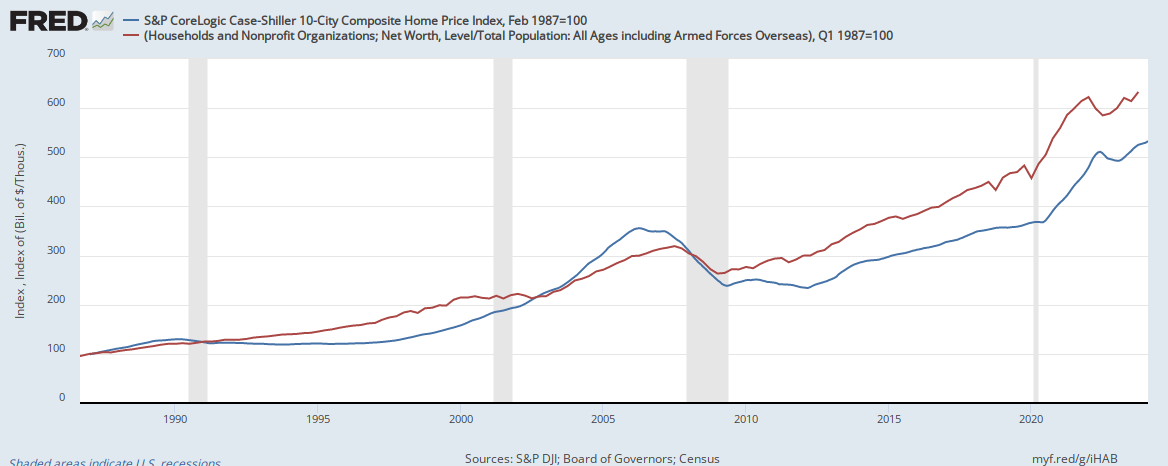
Finally, I believe that this graph represents a major source of frustration for many Americans:

I have shown here a simple new home sales price to median family income indexed to 1975. By this metric, home prices are 50% higher today than they were in 1975 (and I am not even correcting for the much higher percentage of two income households of today). If you are wondering why many have become dissatisfied with our economy and are turning to more radical politics, I would assume that this is a major source.
Here I have plotted the Case-Shiller National Home Price Index along with CPI, where both are indexed to be equal in 1990. What we see is that the growth in home prices has wildly outpaced CPI. In fact, home prices are about 33% higher than where CPI would expect them to be.
But CPI is weighted to represent how much people spend on certain items. Thus, around 40% of CPI is weighted toward housing. So why is CPI not capturing this? Because instead of just using home values, they use something called Owners' Equivalent Rent of Residence:
Look at that graph and you tell me how you think this measure has performed.
I thought that this would be interesting to talk about, and problems like this cause many Americans to ignore economic measures because they do not reflect the reality that they face.
Finally, I believe that this graph represents a major source of frustration for many Americans:
I have shown here a simple new home sales price to median family income indexed to 1975. By this metric, home prices are 50% higher today than they were in 1975 (and I am not even correcting for the much higher percentage of two income households of today). If you are wondering why many have become dissatisfied with our economy and are turning to more radical politics, I would assume that this is a major source.