• This is a political forum that is non-biased/non-partisan and treats every person's position on topics equally. This debate forum is not aligned to any political party. In today's politics, many ideas are split between and even within all the political parties. Often we find ourselves agreeing on one platform but some topics break our mold. We are here to discuss them in a civil political debate. If this is your first visit to our political forums, be sure to check out the RULES. Registering for debate politics is necessary before posting. Register today to participate - it's free!

Death growth rate seems to be flattening

GreatNews2night

Banned
DP Veteran
Joined
Apr 24, 2014
Messages
8,761
Reaction score
3,312
Gender
Male
Political Leaning
Independent
Half an hour before the cut-off point by GMT, we had:

The day before, 1165 deaths.
Today, 1182 deaths.

A DGR of 1.01.

A DGR of 1.0 marks the inflection point, or mid-point of the curve, at which point the daily totals start to drop.

It's safer to use two consecutive 5-day averages, to weed out intervening factors and sheer fluke.

And of course we do know that this may be coming from a regional inflection point, the dwindling of the NY-NJ epicenter, but other epicenters such as Lousiana and Florida may flare up and push the numbers up again.

But I certainly prefer to see 1.01 than 1.65 like on March 31st. Fingers crossed.
 
Half an hour before the cut-off point by GMT, we had:

The day before, 1165 deaths.
Today, 1182 deaths.

A DGR of 1.01.

A DGR of 1.0 marks the inflection point, or mid-point of the curve, at which point the daily totals start to drop.

It's safer to use two consecutive 5-day averages, to week out intervening factors and sheer fluke.

And of course we do know that this may be coming from a regional inflection point, the dwindling of the NY-NJ epicenter, but other epicenters such as Lousiana and Florida may flare up and push the numbers up again.

But I certainly prefer to see 1.01 than 1.65 like on March 31st. Fingers crossed.
I'm gonna wait a little while before celebrating, if it's all the same to everyone.
 
I'm gonna wait a little while before celebrating, if it's all the same to everyone.

Yes, of course, that's why I said my phrase before the last line, starting with "but of course... etc. And that's why I mentioned two consecutive 5-day periods of a flat average.

But aren't you eager for some good news after these terrible past couple of weeks? I am.
 
Yes, of course, that's why I said my phrase before the last line, starting with "but of course... etc. And that's why I mentioned two consecutive 5-day periods of a flat average.

But aren't you eager for some good news after these terrible past couple of weeks? I am.

I am. But I will not allow my eagerness to color my judgment.
 
Half an hour before the cut-off point by GMT, we had:

The day before, 1165 deaths.
Today, 1182 deaths.

A DGR of 1.01.

A DGR of 1.0 marks the inflection point, or mid-point of the curve, at which point the daily totals start to drop.

It's safer to use two consecutive 5-day averages, to weed out intervening factors and sheer fluke.

And of course we do know that this may be coming from a regional inflection point, the dwindling of the NY-NJ epicenter, but other epicenters such as Lousiana and Florida may flare up and push the numbers up again.

But I certainly prefer to see 1.01 than 1.65 like on March 31st. Fingers crossed.

I don't know if it is possible but it would be probably be helpful to put these numbers into two buckets. Bucket one: NY,NJ,CT and Bucket two: All Others. Bucket one represents about 50% of all deaths. So they could be declining but bucket two, all others might be above the numbers you cited.
 
I can't imagine that we are anywhere near the inflection point. That would imply only circa 24k deaths? No way.
 
I don't know if it is possible but it would be probably be helpful to put these numbers into two buckets. Bucket one: NY,NJ,CT and Bucket two: All Others. Bucket one represents about 50% of all deaths. So they could be declining but bucket two, all others might be above the numbers you cited.

Yes, it is possible. This source separates the numbers by state:

United States Coronavirus: 367,004 Cases and 10,871 Deaths - Worldometer

It would take a lot of calculation, though. I don't feel like doing it, but if you want to do it, be my guest and let us know the result.
 
The day before, 1165 deaths.
Today, 1182 deaths.
I'm sorry to tell you that those kind of one-day changes are simply not significant.

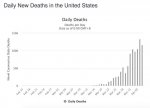
Here is a chart of new deaths per day:

Screen Shot 2020-04-06 at 9.10.13 PM.jpg

There have been several days where there were fewer new deaths than the day before -- but the overall trend is still up.

What we need to see is multiple days of declining death rates. Unfortunately we aren't likely to see that any time soon. For example, New York is likely to level off in a week or so, but other states will start to see higher death rates.
 
I can't imagine that we are anywhere near the inflection point. That would imply only circa 24k deaths? No way.
Yes, probably we will just have one epicenter after the other after the other... and things will keep going.

I so wanted to believe that it is flattening...

But like I said in my OP, it's probably just a fluke caused by a regional inflection point in NJ/NY but we're still very far from a national inflection point.

By the way, some late numbers came in, and the final DGR for April 6th jumped a bit to 1.07. :(
 
I'm sorry to tell you that those kind of one-day changes are simply not significant.

Here is a chart of new deaths per day:

View attachment 67277347

There have been several days where there were fewer new deaths than the day before -- but the overall trend is still up.

What we need to see is multiple days of declining death rates. Unfortunately we aren't likely to see that any time soon. For example, New York is likely to level off in a week or so, but other states will start to see higher death rates.

Agreed, I actually said both things in my OP and/or follow-up posts. That we need two 5-day periods of average GDR of 1.0, and that this is likely to be due to a localized flattening (NY/NJ) followed by peaks elsewhere.

But one could dream...
 
In the areas that have had effective lock downs, for around 2 weeks or so, they will see the death and infection rates drop from now forward. At least until a secondary infection spike arrives from outside the region.

In those areas that have not had effective lock downs for two weeks will see continued growth in infections and deaths. As the NE was the epicenter for the infection in the US and did engage in lockdowns for about 2 weeks the slow down is about right. The biggest unknown is what happens to the rest of the US, will it be contained in areas like the Midwest (Chicago down to St Louis for example). Then when the lock downs in the NE end, will they get a secondary infection event. Remember not even 10% of the population has been infected, that is far to low for herd immunity to have any real effect
 
I'm gonna wait a little while before celebrating, if it's all the same to everyone.

Correct. We are seeing the results of work done two weeks ago, at least with NY. Other States have yet to go there, here in Dallas they are predicting the peek being around the end of April begining of May. Many rural areas have yet to feel the impact and when they do they will not have the systems to deal with it. We are not nearly done but there is an end to the tunnel.
 
Last edited:
Correct. We are seeing the results of work done two weeks ago, at least with NY. Other States have abeay to go, here in Dallas they are predicting the peek being around the end of April begining of May. Many rural areas have yet to feel the impact and when they do they will not have the systems to deal with it. We are not nearly done but there is an end to the tunnel.

What's awesome is that when the curve does begin to drop, people will assume everything is cool and go back to business as usual and then BAM. Right back at it.
 
I don't know if it is possible but it would be probably be helpful to put these numbers into two buckets. Bucket one: NY,NJ,CT and Bucket two: All Others. Bucket one represents about 50% of all deaths. So they could be declining but bucket two, all others might be above the numbers you cited.

Maybe but I am a little concerned we are not getting good information locally. We officially only have 1 death who died elsewhere but I know of at least 3 more local people deaths happening locally and I am not sure why the discrepancy.
 
Yes, of course, that's why I said my phrase before the last line, starting with "but of course... etc. And that's why I mentioned two consecutive 5-day periods of a flat average.

But aren't you eager for some good news after these terrible past couple of weeks? I am.

I don't want to hear good news unless it's true.
 
What's awesome is that when the curve does begin to drop, people will assume everything is cool and go back to business as usual and then BAM. Right back at it.

That is why the transition must an will be staggered.
 
In the areas that have had effective lock downs, for around 2 weeks or so, they will see the death and infection rates drop from now forward.

I would not expect them to drop together. Deaths happen 2-8 weeks later. So I would expect apex for death numbers to be weeks after apex for infections. Contradicting this theory is Italy and Spain where death apex appears to be happening only 1 week after apex for infections - still not together but surprisingly closer. I don't know why.

I suppose one possibility is that counts are wrong in some where - either infections or deaths or both are miscounted in some way.
 
Maybe but I am a little concerned we are not getting good information locally. We officially only have 1 death who died elsewhere but I know of at least 3 more local people deaths happening locally and I am not sure why the discrepancy.

Good point. I am lucky in that the town selectperson here sends out phone messages and texts every few days. Just learned we had our first death in town yesterday.
 
What's awesome is that when the curve does begin to drop, people will assume everything is cool and go back to business as usual and then BAM. Right back at it.

Yes, this is a very distinct risk, if people get overconfident.
 
Maybe but I am a little concerned we are not getting good information locally. We officially only have 1 death who died elsewhere but I know of at least 3 more local people deaths happening locally and I am not sure why the discrepancy.

Well, it could be a matter of confirmation. Certain tests are taking 7 to 10 days to come back. So, you may have had 3 deaths that are suspicious but not confirmed, and once these tests are back, they will be reported of the local Health Department as COVID-19 deaths and will be counted.
 
It's been 102 years since the last pandemic. We have forgotten how to act.

Actually, no. The 2009 N1H1 was also classified as a pandemic. The 1968 H3N2 also received this classification.

But sure, they were smaller.
 
Actually, no. The 2009 N1H1 was also classified as a pandemic. The 1968 H3N2 also received this classification.

But sure, they were smaller.

I just checked, and I stand corrected.
 
Half an hour before the cut-off point by GMT, we had:

The day before, 1165 deaths.
Today, 1182 deaths.

A DGR of 1.01.

A DGR of 1.0 marks the inflection point, or mid-point of the curve, at which point the daily totals start to drop.

It's safer to use two consecutive 5-day averages, to weed out intervening factors and sheer fluke.

And of course we do know that this may be coming from a regional inflection point, the dwindling of the NY-NJ epicenter, but other epicenters such as Lousiana and Florida may flare up and push the numbers up again.

But I certainly prefer to see 1.01 than 1.65 like on March 31st. Fingers crossed.

I would like to see at least 4 or 5 data points in a row before I make that determination, but it is hopeful. Hope is such a fragile thing though.
 
Back
Top Bottom