• This is a political forum that is non-biased/non-partisan and treats every person's position on topics equally. This debate forum is not aligned to any political party. In today's politics, many ideas are split between and even within all the political parties. Often we find ourselves agreeing on one platform but some topics break our mold. We are here to discuss them in a civil political debate. If this is your first visit to our political forums, be sure to check out the RULES. Registering for debate politics is necessary before posting. Register today to participate - it's free!

UPDATE: Curve Continues To Flatten - Just As Mashmont Predicted.

Status
Not open for further replies.
LOL!!! This still puts us well to the left of the peak of the curve dude. Increasing at a decreasing rate puts us maybe at best 25% of the way through the curve. So if that took two weeks Easter is when we're going to be at the peak of the curve.
Yep. If that's the case, that could mean the US will settle in at 200,000 or more new cases per day, until the rate really starts to drop.

And there's a very good chance it won't drop right away. Italy has had its restrictions in place for a few weeks, and it's stuck at 5000+ new cases per day.
 
I know no one needs to see it but.... Yeah, I'm seriously bored and seriously procrastinating. :mrgreen:

Mashmont explained earlier in this thread that what he's doing is merely dividing the new value by the old value, and then multiplying the result to get a "percentage increase." To make his "predictions," it looks like what he's doing is multiplying a 4-day old value by an arbitrarily reduced "percentage."

Needless to say, this model produces some... issues.

Here's his 3/25 "prediction," and presumably why he thought there would be no more than 130,000 cases:

View attachment 67276606


And his "fixed" "prediction:"

View attachment 67276605

The most obvious flaw of this method is that after a few days, it suggests that the total number of cases will actually drop. (This is indicated in bold.) Obviously, that's not possible.

The next issue is that after a few days, his predictions become ludicrously inaccurate. To wit: So far, cases are doubling roughly every 2.5 - 3 days. If that keeps up (which is likely,) then his prediction will be off by 330,000 cases. As a result, and I'm sure this will surprise no one, he will "fix" his predictions day after day, thus trying to hide the massive long-term inaccuracies.

It's really fascinating what happens when a total lack of math skills collides with wishful thinking, yes?

I was thinking of opening a thread called "CV-19 Fun With Numbers". But this thread will do.

I didn't bother to see how MM obtained his numbers or examine his calculation methodology. However, I did use his actual posted numbers fitted to a logarithmic trend line. I used two trends (which should be mirror images of each other) to calculate when the peak values will be reached AND what the total cases would be.

How "valid" this number is I will leave for others to dispute, but I suspect there are too few actual data points and the trend line won't turn out to be logarithmic.

It would seem that the trend line for 100 days maxs out at 140K - pretty close to his calculations.


COVID Mashmont .jpg
 
0bama and his party CAUSED the recession. They don't get to use it as an excuse for their later failures.

January 20, 2009. Obama Inaugurated as President
February 11, 2009 American Recovery and Reinvestment Act became effective

WOW. that is one short recession!!!!!
 
How "valid" this number is I will leave for others to dispute....
lol... Okay then. His numbers aren't valid.

His methodology is not based on actual percentage changes. All he's doing is multiplying past days, and this completely misses the exponential nature of the virus' growth.

That's why he keeps blowing his predictions. E.g. he predicted 115,000 total cases today; it's not even 6PM Eastern Time, and he's already off by 5,000 cases. Tomorrow, he will likely be off by 10,000 cases; by Monday, 15,000....


It would seem that the trend line for 100 days maxs out at 140K.
Yes, and according to his "method," that will happen in about 1 week. To put it mildly, that's insane.
 
. ....... the current trend which, for eight days running, saw the 3-day rolling average increse DROP yet again. Mashmont is still sticking with the view the curve will be going downhill Easter week as the president proclaims. Recall, I was the only scientist saying this a few days ago. Now others have joined in. The differs sharply from the leftwing 'scientists' saying this current cycle could go through mid-to-late summer (absurd!)

I am now getting my past numbers from infection2020.com. Here are the numbers, and here are the predictions for the next three days in red: Let's see how we do.

Mar 16-19 4727 14332 312% increase
Mar 17-20 6507 19762 304% increase
Mar 18-21 9421 26881 285% increase
Mar 19-22 14332 35226 245% increase
Mar 20-23 19762 46455 218% increase
Mar 21-24 26881 55225 205% increase
Mar 22-25 35226 69222 196% increase
Mar 23-26 46455 86043 185% increase
Mar 24-27 55225 96643 175% increase
Mar 25-28 69222 114909 166% increase
Mar 26-29 86043 134227 156% increase

Looks like you did say average increase. And it's spelled 'increase' not 'increse'.
 
lol... Okay then. His numbers aren't valid.

His methodology is not based on actual percentage changes. All he's doing is multiplying past days, and this completely misses the exponential nature of the virus' growth.

That's why he keeps blowing his predictions. E.g. he predicted 115,000 total cases today; it's not even 6PM Eastern Time, and he's already off by 5,000 cases. Tomorrow, he will likely be off by 10,000 cases; by Monday, 15,000....

Yes, and according to his "method," that will happen in about 1 week. To put it mildly, that's insane.

Well, one can fit the same small dataset to an exponential chart as well. This might be called Visbek's Forecast Refutation … 40 days and nearly 4.5 million cases.

COVID Mashmont Visbeck.jpg
 
1 million is ridiculous. There is no way that number will be reached unless progress reverses slows to a crawl. A one-session small increase won't change that. Everybody is jumping on the one-time anomaly to say "See, Mash??"

But if that does happen, then we will continue to suspect funny business from the deep-stater leftists at the CDC

WUHAN VIRUS

Inaccurate Virus Models Are Panicking Officials Into Ill-Advised Lockdowns
Inaccurate Virus Models Are Panicking Officials Into Ill-advised Lockdowns

How a handful of Democratic activists created alarming, but bogus data sets to scare local and state officials into making rash, economy-killing mandates.

By Madeline Osburn
MARCH 25, 2020

As U.S. state and local officials halt the economy and quarantine their communities over the Wuhan virus crisis, one would hope our leaders were making such major decisions based on well-sourced data and statistical analysis. That is not the case.

A scan of statements made by media, state governors, local leaders, county judges, and more show many relying on the same source, an online mapping tool called COVID Act Now. The website says it is “built to enable political leaders to quickly make decisions in their Coronavirus response informed by best available data and modeling.”

An interactive map provides users a catastrophic forecast for each state, should they wait to implement COVID Act Now’s suggested strict measures to “flatten the curve.” But a closer look at how many of COVID Act Now’s predictions have already fallen short, and how they became a ubiquitous resource across the country overnight, suggests something more sinister.

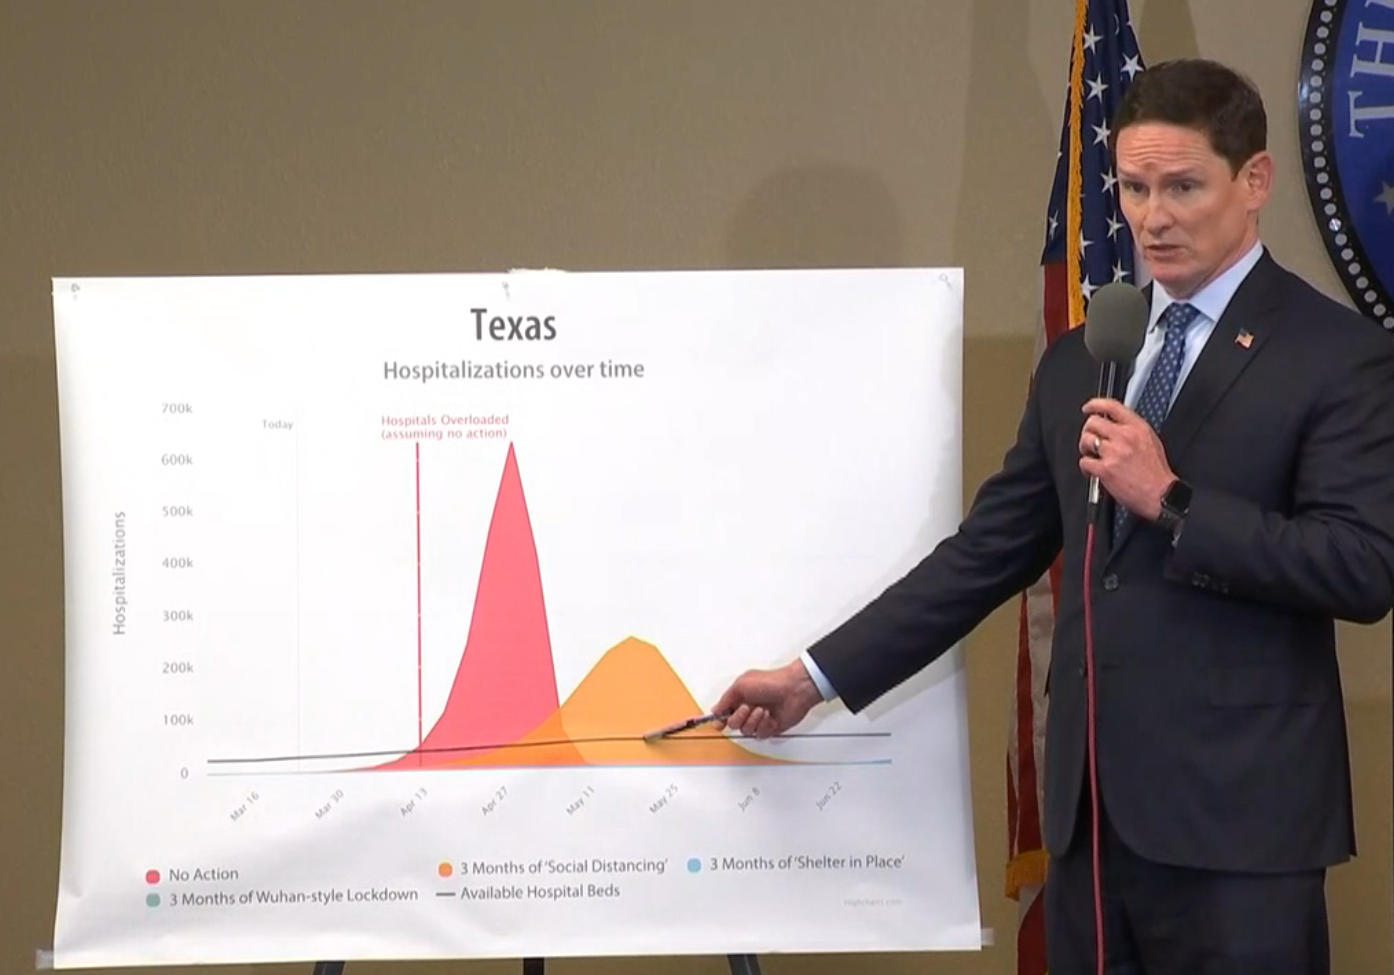
When Dallas County Judge Clay Jenkins announced a shelter-in-place order on Dallas County Sunday, he displayed COVID Act Now graphs with predictive outcomes after three months if certain drastic measures are taken. The NBC Dallas affiliate also embedded the COVID Act Now models in their story on the mandate.

Screen-Shot-2020-03-24-at-10.26.54-PM.png

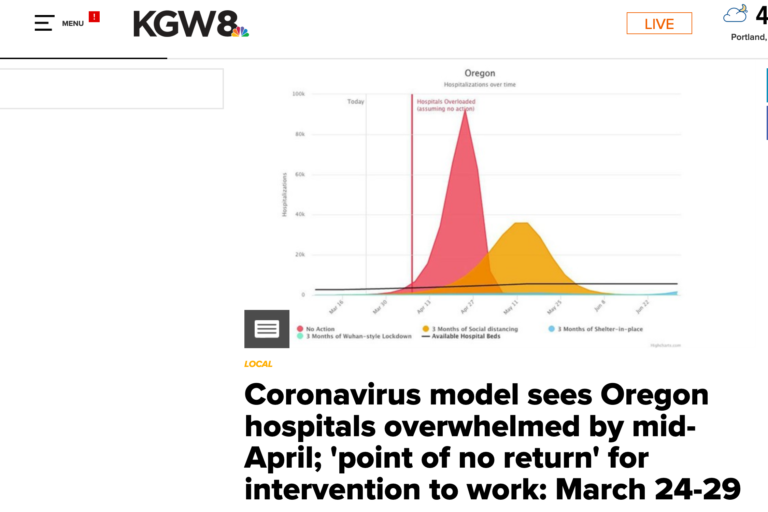
The headline of an NBC Oregon affiliate featured COVID Act Now data, and a headline blaring, “Coronavirus model sees Oregon hospitals overwhelmed by mid-April.” Both The Oregonian and The East Oregonian also published stories featuring the widely shared data predicting a “point of no return.”

Screen-Shot-2020-03-24-at-10.31.37-PM-768x512.png


Michigan Gov. Gretchen Whitmer cited COVID Act Now when telling her state they would exceed 7 million cases in Michigan, with 1 million hospitalized and 460,000 deaths if the state did nothing.

A local CBS report in Georgia featured an Emory University professor urging Gov. Brian Kemp with the same “point of no return” language and COVID Act Now models.
Click link above for full article.
COVID Act Now’s models are based on the Imperial College UK projection of 500,000 death in the U.K., a doomsday scenario, already been proven to be wildly wrong. Michigan Gov. Gretchen Whitmer referred to COVID Act Now when telling her state “they would exceed 7 million cases in Michigan, with 1 million hospitalized and 460,000 deaths if the state did nothing.” COVID Act Now to prevent a catastrophe in the healthcare system recommend a shutdown to “flatten the curve” Of course, the economic impact of a lockdown are much higher than the coronavirus. As the saying goes” the remedy is worse than the disease.”
 
This isn't a straight line. It's a curve. Derp.
All lines have an equation to describe them.
All lines are not straight.
A curve is a line.
All lines can be plotted on an X, Y graph.
You obviously know little about math.
Total failure by you continually.
 
0bama and his party CAUSED the recession. They don't get to use it as an excuse for their later failures.

Interesting that Obama caused a recession that began a year before he took office! :2rofll:
 
Well, one can fit the same small dataset to an exponential chart as well. This might be called Visbek's Forecast Refutation … 40 days and nearly 4.5 million cases.
What the what?

We have weeks of data from all over the world, showing fairly rapid spread. Total cases in the US are, again, doubling roughly every 2.5 days; if that keeps up, we'll be at 4 million cases in 16 days. Not 40.

Cases Double Every 3 Days (Linear Scale).jpg


Does that curve look familiar by now? It should, since it's similar to almost every linear graph of COVID-19's spread.

The number of cases won't expand at that rate indefinitely, but it is very likely to stay in that range for at least the next week. We could easily see 100,000 new cases per day before seeing the impact of control efforts -- which, we should note, are spotty at best.

Here's the actual total cases for the US, followed by new daily cases. Do those graphs suggest to you that the total number of cases will screech to a halt in just 4 days?

Screen Shot 2020-03-28 at 8.44.03 PM.jpg

Screen Shot 2020-03-28 at 8.47.05 PM.jpg


Keep in mind, again: Mashmont -- who originally said "130,000 cases maximum" based on his "method" -- is not saying that the number of new cases will stabilize in 4 days. He's saying ZERO new cases in 4 days. And he's basing that by on by arbitrarily reducing a multiplier he's adding to the number of cases from 3 days earlier. It's ridiculous.

It is well past time to get real. This is not going to be over in 2 weeks; we are at the start of a very long slog.
 
Cases in the U.S. hit 2,000 yesterday, doubling from the day before. That curve is not flattening out. It's accelerating upward.
 
All lines have an equation to describe them.
All lines are not straight.
A curve is a line.
All lines can be plotted on an X, Y graph.
You obviously know little about math.
Total failure by you continually.

No, only a straight line can be described with a linear equation. Curves cannot. Geometrically, a line extends in only two directions. You're over your head on this.
 
Cases in the U.S. hit 2,000 yesterday, doubling from the day before. That curve is not flattening out. It's accelerating upward.

Deaths were only at 1716 at the end of yesterday. They passed 2000 today. That's not close to doubling in a day.
 
What the what?

We have weeks of data from all over the world, showing fairly rapid spread. Total cases in the US are, again, doubling roughly every 2.5 days; if that keeps up, we'll be at 4 million cases in 16 days. Not 40.

View attachment 67276632


Does that curve look familiar by now? It should, since it's similar to almost every linear graph of COVID-19's spread.

The number of cases won't expand at that rate indefinitely, but it is very likely to stay in that range for at least the next week. We could easily see 100,000 new cases per day before seeing the impact of control efforts -- which, we should note, are spotty at best.

Here's the actual total cases for the US, followed by new daily cases. Do those graphs suggest to you that the total number of cases will screech to a halt in just 4 days?

View attachment 67276633

View attachment 67276634


Keep in mind, again: Mashmont -- who originally said "130,000 cases maximum" based on his "method" -- is not saying that the number of new cases will stabilize in 4 days. He's saying ZERO new cases in 4 days. And he's basing that by on by arbitrarily reducing a multiplier he's adding to the number of cases from 3 days earlier. It's ridiculous.

It is well past time to get real. This is not going to be over in 2 weeks; we are at the start of a very long slog.

As I said, I'm not going to comment on Mashmont's "method". MM has to be incorrect, but I'm just having some speculative fun while learning a new spreadsheet "Libre'" . To that end I am fitting trend lines to the several data points he posted.

The exponential trend line is a "best fit" IF the rise is best reflected by an exponential equation - on the other hand the actual data may be a best fit with geometric function, or powers, etc.

But I will look again and how I used the numbers, and where I placed the null values. The distance between survey dates may have been improperly spaced.
 
Is Italy at a stage to lift Covid-19 restrictions?
 
So for argument's sake, let's say these numbers are real. Trump spent months pretending this was no big deal and refused to take the measures necessary to prevent the spread early like SK. He then suggested a quarantine, like every other country on earth had already done at that point, and now as the scientists predicted it was completely justified to do so and the infection rate is decreasing. Now, while infections are still increasing by 185%, Trump wants to preemptively stop the quarantine way too early.

I find it totally bizarre that Trump and his supporters had to be dragged kicking and screaming into a quarantine where they called it totally unnecessary and not worth the gain, and now they turn around and pretend it was their idea and Trump deserves the credit.

You're a wildly dishonest person and once again, your celebrations are catastrophically premature.


Ffs, don't call yourself a scientist and don't pretend this was your idea that the real scientists are now "catching onto".

A Dem Hoax ya words matter Righties your boys BS the last two months left this country woefully unprepared. Wow my head is just spinning from all this winning:roll:
 
That's like saying the markets had a good day after a five hundred point drop instead of a thousand. Idiotic.
 
Ok, so you hate Obama, but why do you post retarded crap lies?

No lie there. The economy was humming right along until 0bummer and his fellow Democrat Congressmen crashed the economy.
 
No lie there. The economy was humming right along until 0bummer and his fellow Democrat Congressmen crashed the economy.

You think nobody here was looking back then? That we will believe your deliberately dishonest statements over what we saw with our own eyes?
 
Status
Not open for further replies.
Back
Top Bottom