- Joined
- Jul 6, 2017
- Messages
- 122,485
- Reaction score
- 19,845
- Gender
- Undisclosed
- Political Leaning
- Undisclosed
Math be hard.
Hey he has a math degree from Larry's college and bait shop

Math be hard.
I am a math wonk as everybody knows...
America is BRIMMING with optimism!!!!
Note. Predictions are in red. They have not happened yet.
3-Day: Cases Beg: Cases End:
Mar 18-21 6332 19862 313% increase
Mar 19-22 9572 27021 282% increase
Mar 20-23 14312 35409 247% increase
Mar 21-24 19862 46158 232% increase
Mar 22-25 27021 54428 201% increase
Mar 23-26 35409 66710 190% increase
Mar 27-30 46158 78468 170% increase
Mar 28-31 54428 81642 150% increase
Remember Mashmont's predictions, people. Only 10,400 deaths, max. Only 130,000 COVID cases, max. This wouldn't make a garden variety flu season. Can you say hoax?
Hey he has a math degree from Larry's college and bait shop
We're gonna pretend this didn't happen?
I'm notWe're gonna pretend this didn't happen?

Having 80% of the US infected by easter weekend is not a good thing
You're a self described "scientist" who doesn't learn. The idea of flattening an epidemic's curve by the percentage decline in infections is simply stupid. This is explained in your mirror thread but the explanation of course didn't sink in. One look at your numbers, going from 4,727 to 96,643 in less than two weeks, is not quite the good news you think it is.
It would be a great thing because that many would build an immunity from this particular CHINA Virus. What everyone her is forgetting is that not everyone gets this and not everyone has bad trouble with it.
Yeah, but since when do Communists tell the truth? They never have. And China has lied bigtime three months ago.
Good job Mr. President!
No doctor that's wrong. No one agrees with that
Evidence please. you just saying this means little
Since I've been in this board I've not seen one poster so wrong so often.
But, I doubt read everyone.
The rule is that if Masmont makes a claim, it's wrong.
:mrgreen:He thinks it is for skiing on.
Guys, recall a couple of days ago, the president ignited the stock market by proclaiming America would be open for business Easter week. Looks like the great man's optimism worked. DJIA has risen 3000 points in three days!! Now the libs have to give him credit for this giant boost since they did the same for 0bummer in 2009 when the market went up after he tanked it.
The president's optimism is borne out by the current trend which, for eight days running, saw the 3-day rolling average increse DROP yet again. Mashmont is still sticking with the view the curve will be going downhill Easter week as the president proclaims. Recall, I was the only scientist saying this a few days ago. Now others have joined in. The differs sharply from the leftwing 'scientists' saying this current cycle could go through mid-to-late summer (absurd!)
I am now getting my past numbers from infection2020.com. Here are the numbers, and here are the predictions for the next three days in red: Let's see how we do.
Mar 16-19 4727 14332 312% increase
Mar 17-20 6507 19762 304% increase
Mar 18-21 9421 26881 285% increase
Mar 19-22 14332 35226 245% increase
Mar 20-23 19762 46455 218% increase
Mar 21-24 26881 55225 205% increase
Mar 22-25 35226 69222 196% increase
Mar 23-26 46455 86043 185% increase
Mar 24-27 55225 96643 175% increase
Mar 25-28 69222 114909 166% increase
Mar 26-29 86043 134227 156% increase

It would be a great thing because that many would build an immunity from this particular CHINA Virus. What everyone her is forgetting is that not everyone gets this and not everyone has bad trouble with it.
....... for eight days running, saw the 3-day rolling average increse DROP yet again. Mashmont is still sticking with the view the curve will be going downhill Easter week as the president proclaims. Recall, I was the only scientist saying this a few days ago. Now others have joined in. The differs sharply from the leftwing 'scientists' saying this current cycle could go through mid-to-late summer (absurd!)
I am now getting my past numbers from infection2020.com. Here are the numbers, and here are the predictions for the next three days in red: Let's see how we do.
Mar 16-19 4727 14332 312% increase
Mar 17-20 6507 19762 304% increase
Mar 18-21 9421 26881 285% increase
Mar 19-22 14332 35226 245% increase
Mar 20-23 19762 46455 218% increase
Mar 21-24 26881 55225 205% increase
Mar 22-25 35226 69222 196% increase
Mar 23-26 46455 86043 185% increase
Mar 24-27 55225 96643 175% increase
Mar 25-28 69222 114909 166% increase
Mar 26-29 86043 134227 156% increase
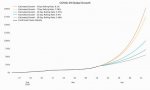
Mash, I'm going to make this very simple for you.
Now you tell me, Mashmont. According to the above graph from the website that you provided, is the curve flattening? Yes or no. Very simple question.
Mash, I'm going to make this very simple for you.
Let's look at a chart that comes from the website that you linked to. We will assume for the moment that every one of your numbers, not including predictions, are correct.
View attachment 67276546
Now you tell me, Mashmont. According to the above graph from the website that you provided, is the curve flattening? Yes or no. Very simple question.
ignore chart. posted the wrong one.

Yes there is a decreasing % of increase. That doesn't mean the actual number of cases are decreasing it just means is they are not increasing as fast as they did at the beginning of the epidemic.
Mar 21-24 26881 55225 205% increase
Mar 22-25 35226 69222 196% increase
Mar 23-26 46455 86043 185% increase
Mar 24-27 55225 96643 175% increase
Mar 25-28 69222 114909 166% increase
Mar 26-29 86043 134227 156% increase
-----------------------------------------------------------hypothetical extension of % increases (and yes the numbers are not consistent )until the numbers are the same or very close in which case the % increase would be at or near !00%. How does that make sense?
Mar 27-30 90000-----135000.-----150%........increase
Mar 28-31 100000-----140000-----140%--------increase
Mar 29-01 120000-----142000-----118%-------increase
Mar 30-02 145000-----145000-----100%-------- increase?????? actual % of increase is 0%. And why aren't you presenting the % increase in the standard way(Mar 26-29. 86043......134227 =56% increase)
lolWe know the numbers are increasing, but the rate of increase is decreasing. Showing it in the 'standard' way wouldn't demonstrate that.