• This is a political forum that is non-biased/non-partisan and treats every person's position on topics equally. This debate forum is not aligned to any political party. In today's politics, many ideas are split between and even within all the political parties. Often we find ourselves agreeing on one platform but some topics break our mold. We are here to discuss them in a civil political debate. If this is your first visit to our political forums, be sure to check out the RULES. Registering for debate politics is necessary before posting. Register today to participate - it's free!

UPDATE: Curve Continues To Flatten - Just As Mashmont Predicted.

Status
Not open for further replies.
1 million is ridiculous. There is no way that number will be reached unless progress reverses slows to a crawl. A one-session small increase won't change that. Everybody is jumping on the one-time anomaly to say "See, Mash??"

But if that does happen, then we will continue to suspect funny business from the deep-stater leftists at the CDC

Personally I'm jumping on the fact that you just up and changed your predictions once it turned out they were way wrong.
 
Guys, recall a couple of days ago, the president ignited the stock market by proclaiming America would be open for business Easter week. Looks like the great man's optimism worked. DJIA has risen 3000 points in three days!! Now the libs have to give him credit for this giant boost since they did the same for 0bummer in 2009 when the market went up after he tanked it.

The president's optimism is borne out by the current trend which, for eight days running, saw the 3-day rolling average increse DROP yet again. Mashmont is still sticking with the view the curve will be going downhill Easter week as the president proclaims. Recall, I was the only scientist saying this a few days ago. Now others have joined in. The differs sharply from the leftwing 'scientists' saying this current cycle could go through mid-to-late summer (absurd!)

I am now getting my past numbers from infection2020.com. Here are the numbers, and here are the predictions for the next three days in red: Let's see how we do.

Mar 16-19 4727 14332 312% increase
Mar 17-20 6507 19762 304% increase
Mar 18-21 9421 26881 285% increase
Mar 19-22 14332 35226 245% increase
Mar 20-23 19762 46455 218% increase
Mar 21-24 26881 55225 205% increase
Mar 22-25 35226 69222 196% increase
Mar 23-26 46455 86043 185% increase
Mar 24-27 55225 96643 175% increase
Mar 25-28 69222 114909 166% increase
Mar 26-29 86043 134227 156% increase

We've already exceeded the prediction for March 27th, and it's only mid-day.

This is not a cause for celebration, and I am not posting this to celebrate. I'm posting because we need to get on board with taking this thing seriously.
 
Mashmont's prediction for March 28th: 114,909 cases

Confirmed cases, as of 2PM: 114,958 cases

Hmmm.

In the ballpark. Thanks for noticing.
 
We've already exceeded the prediction for March 27th, and it's only mid-day.

This is not a cause for celebration, and I am not posting this to celebrate. I'm posting because we need to get on board with taking this thing seriously.

Today's the 28th, and we're not that far off. 3000 over right now. That's a win. Yesterday, we were 8000 over. As I told everybody, wait until Sunday when the tally is in to see how Mashmont did.
 
Today's the 28th, and we're not that far off. 3000 over right now. That's a win. Yesterday, we were 8000 over. As I told everybody, wait until Sunday when the tally is in to see how Mashmont did.

By this time yesterday we were under your prediction.
 
No, it isn't.

The number of total cases has doubled roughly every 3 days. (Go ahead, do the math, and show your work in this thread. I dare you.)

That means the US will probably have 1 million total cases by April 7th.

It is possible that the number of new cases will level off around that time. If so, we'll still be adding more than 200,000 new cases per day.


No, dude. You've blown every prediction you've made... and you've made more than one prediction.


LOL

Why wait? Why not blame them right now for your missed predictions?

It's not doubling every three days anymore.
 
I know no one needs to see it but.... Yeah, I'm seriously bored and seriously procrastinating. :mrgreen:

Mashmont explained earlier in this thread that what he's doing is merely dividing the new value by the old value, and then multiplying the result to get a "percentage increase." To make his "predictions," it looks like what he's doing is multiplying a 4-day old value by an arbitrarily reduced "percentage."

Needless to say, this model produces some... issues.

Here's his 3/25 "prediction," and presumably why he thought there would be no more than 130,000 cases:
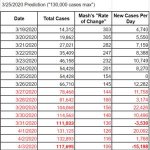
2020-03-28_16-08-04.jpg


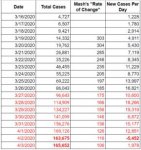
And his "fixed" "prediction:"

2020-03-28_15-52-24.jpg

The most obvious flaw of this method is that after a few days, it suggests that the total number of cases will actually drop. (This is indicated in bold.) Obviously, that's not possible.

The next issue is that after a few days, his predictions become ludicrously inaccurate. To wit: So far, cases are doubling roughly every 2.5 - 3 days. If that keeps up (which is likely,) then his prediction will be off by 330,000 cases. As a result, and I'm sure this will surprise no one, he will "fix" his predictions day after day, thus trying to hide the massive long-term inaccuracies.

It's really fascinating what happens when a total lack of math skills collides with wishful thinking, yes?
 
Then why are you making multiple threads about the number of cases? :roll:


LOL

Thank you for proving that you do not know how to properly calculate a percentage increase.

Maybe this will help you. But I dunno, 7th Grade... might be a bit advanced for you.


By the way... You're correcting yourself. You said 302%, not me.


I mean. I repeatedly said, my chart did not denote percentage increase. It was percentage of the original. Sorry you don't understand math.
 
Any line is a linear equation.
Try again, math genius.
Any comments on the positive slope?
Do you know what a positive slope means?

This isn't a straight line. It's a curve. Derp.
 
I mean. I repeatedly said, my chart did not denote percentage increase. It was percentage of the original. Sorry you don't understand math.
LOL

No, you have repeatedly referred to it as a "percentage increase." This includes phrases like "Five straight 3-day periods of a drop in the rate of increase" and "Mar 18-21 6332 19862 313% increase"

And, of course, you were completely mystified by my earlier charts which showed an actual and correct rate of increase.

Oh, and see my post just above to see why your "percentage of the original" method doesn't work.
 
Guys, recall a couple of days ago, the president ignited the stock market by proclaiming America would be open for business Easter week.
Umm...the stock market responded to news that Congress was passing a stimulus package.

0bummer in 2009 when the market went up after he tanked it.
Bwhahahahahahah!!! Are you ****ing serious? The market began its free fall in 2007. Since you're clearly not a math guy that's two years before President Obama took office. The recession ended just 6 months after he took office in the same month that his Stimulus package started to flow into the economy.

Recall, I was the only scientist
If you're a scientist then I'm the queen of ****ing England.

175% increase
Mar 25-28 69222 114909 166% increase
Mar 26-29 86043 134227 156% increase

LOL!!! This still puts us well to the left of the peak of the curve dude. Increasing at a decreasing rate puts us maybe at best 25% of the way through the curve. So if that took two weeks Easter is when we're going to be at the peak of the curve.
 
Status
Not open for further replies.
Back
Top Bottom