- Joined
- Apr 24, 2014
- Messages
- 8,761
- Reaction score
- 3,312
- Gender
- Male
- Political Leaning
- Independent
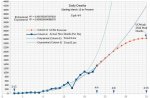
Let's see where we are over the last 5 days with the total deaths, the only reliable number:
April 4 = 1,331
April 3 = 1,045
April 2 = 974
April 1 = 1,049
March 31 = 912
March 30 = 558
Let's calculate the average Death Growth Factor for the last 5 days (once it drops to 1.0 we have the inflection point):
April 4 = 1.27
April 3 = 1.07
April 2 = 0.93
April 1 = 1.15
March 31 = 1.63
OK, March 31st was an outlier. It was diffused that it had to do with incomplete reporting over the weekend, so it's fair to toss it.
If we count it, we have an average of 1.21, still far from the inflection point.
If we don't count March 31st, we have an average of 1.1, which is lower than it had been in two previous 5-day periods I calculated before, indicating that we may be slowly approaching the peak.
For those not following this discussion: the DGR (death growth rate) is obtained by dividing the number of deaths in a given day by the number the previous day. Given daily up-and-down variation in the context of spurious factors (like, the virus gets to a cluster of nursing homes), we use a 5-day average.
When this 5-day average remains around 1.0 in two consecutive 5-day periods, we likely have reached the peak or inflection point. That's the mid-point of the curve. The total deaths by that day, will be likely to be half of the final tally at the end of the pandemic, so, when you reach the inflection point, you double the number of deaths you had thus far, and you have a rather good estimate of the total, at the end of the pandemic.
Last time I calculated a 5-day average it was around 1.25. If it dropped to 1.1, it's a good sign, but in order for it to get down to 1.0, we may still have a way to go, since it will bounce up again once other major cities peak.
Still, April 21st is 17 days from now, so I continue to estimate that this will peak by April 21st.
The only way (I could explain why, but I don't feel like it, right now) that my calculation is wrong, is if I'm underestimating the CFR. If it is 1.4%, or up to the WHO's estimate of 3.4%, then my model overestimates the total infected cohort, meaning that it is currently smaller than I though, thus prolonging the time for herd immunity that would flatten the curve, so the peak will be later than April 21st.
Last edited: