- Joined
- Dec 9, 2009
- Messages
- 134,496
- Reaction score
- 14,621
- Location
- Houston, TX
- Gender
- Male
- Political Leaning
- Conservative
The root cause of the financial crisis will be disputed into the infinitum. My view is that the CRA started the whole ball rolling (back in the 90's) with more and more stringent mandates on subprime lending. It then morphed into GSEs eating all the crap the banks generated as part of the CRA circle jerk. I understand the counter point in that if banks were required to have higher reserves, capital ratios, or a thousand other things that may have changed the course and path things went. However I still believe this was part of the Greenspan/Clinton plan to help lower income folks build wealth through homeownership via the CRA. It was good intentioned and the only way to get the banks to go along with it was the threat of their charter followed by the ability to dump it all into the GSEs with an implied backstop. After that is just turned into Frankenstein all on its own.
I am sorry you are having so much trouble understanding. The link you posted is a very basic and, frankly, elementary version of how sovereign financing works. If that is what you are basing your knowledge on going into a debate about global finance, then you should probably just sit at the kids table.
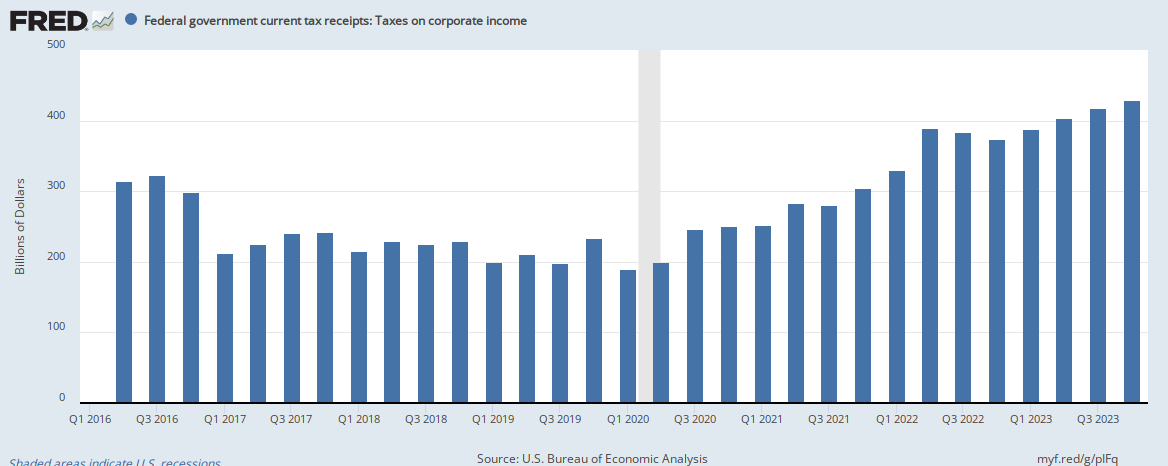
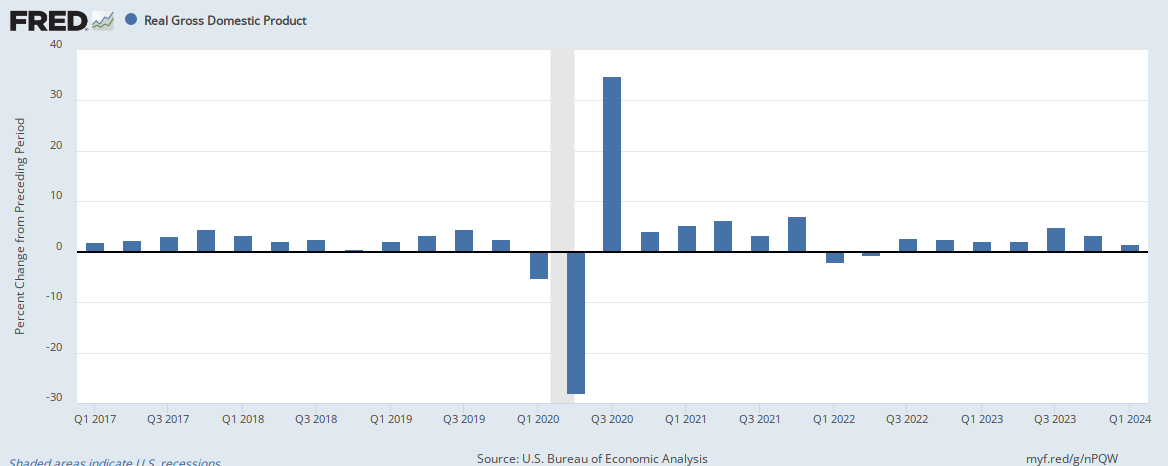
No, what you are doing is making the simple complex. the budget deficit is quite clear and has to be funded with taxes. Almost the entire 2017 and 2018 deficit increases were due to interest expense and entitlement spending increases and have nothing to do with the tax cuts as the tax cuts stimulated economic activity and grew our economy 700 billion in 2017 and over a trillion dollars in 2018, bea.gov