• This is a political forum that is non-biased/non-partisan and treats every person's position on topics equally. This debate forum is not aligned to any political party. In today's politics, many ideas are split between and even within all the political parties. Often we find ourselves agreeing on one platform but some topics break our mold. We are here to discuss them in a civil political debate. If this is your first visit to our political forums, be sure to check out the RULES. Registering for debate politics is necessary before posting. Register today to participate - it's free!

BLS: Non-Farm Payrolls +157K; Expected 193K; Unemployment Rate 3.9%; Average Hourly Earnings 2.7%

How would that affect the manufacturing industry who has been affected the most by the tariffs?

If you have a bunch of extra stock laying around you're not going to manufacture more. If someone takes it off your hands real quick you'll need to build it back up. That doesn't mean you'll be able to sell it quickly, but you'll need the workers to build it. Just a theory.
 
your year to date numbers for 2018 don't include the 157 from this month. It should be 1,503. Still nothing too special. Perfectly fine numbers, but not better than 2014 or 2015 when we did not have tax cuts in place, and we were reducing the deficit.

Yes, they do. Here are the months:
Jan 176
feb 324
Mar 155
Apr 175
May 244
Jun 213
Jul 157
1444
 
Thank you, Barack Obama.

You can try, try, try. But nobody is buying that baloney.

Hispanic approval of Trump is on a rapid rise. Better jobs are the reason. That is a serious problem for your party.
 
Yes, they do. Here are the months:
Jan 176
feb 324
Mar 155
Apr 175
May 244
Jun 213
Jul 157
1444

You're missing some upward revisions for May and June, which is you're calculating it wrong.

Fred hasn't updated their database yet, just in case you're getting the numbers from them.
 
You don't need to give Trump credit, but to say that the economy hasn't "changed in the trajectory" isn't accurate.

Average monthly jobs have gone from a high in 250K in 2014 to a low of 185K in 2017; it was 195K average in 2016. During the same time frame, average annual GDP growth has gone from 2.5% in 2014 to 1.6% in 2016. Now the economy is probably on track to reach 3% growth this year.
Sorry, but no. I would not consider that to be a significant change in trajectory. Certainly not worth increasing the deficits or starting a trade war to obtain such a small blip. In fact, given that we were already pushing full employment before Trump took office what you're calling a change in trajectory could very easily be an economic bubble that will cause more long-term damage than it gives us.

It's nothing like that at all because the trends are clearly different. It's one thing to suggest that this would have happened anyway; it's another to suggest that everything is simply the same. It isn't.
Ummm... no sorry, but again these numbers are below what we saw in 2014 and 2015. You can talk about buybacks all you want, but the reality is that we're basically at full employment already. These numbers are fine, but they're nothing incredibly different than what we've seen over the last few years. In 2016 we had 4 months of job growth above 200k, including one above 300k. Bad weather in May of that year made it look less impressive. So basically what we're seeing is that in Trump's first-year job creation fell off significantly. Likely not entirely his fault as most of Obama's policies were still in place, but likely naturally caused by the fact that we were approaching full employment and reducing our deficits further.

Now we're back to numbers that are pretty similar and possibly still lower than we had towards the end of Obama's term, but we're running higher deficits to get there. I'd say best case scenario is that these are still normal numbers that haven't really been impacted by what Trump and Republicans are doing. The worst case scenario is that they're actually fuelling a little bit of a bubble again.
 
Hispanic approval of Trump is on a rapid rise.
HAHAHAHA!!!!

Who told you that load of garbage? Last I checked Hispanics don't like having their families torn apart or their children being locked in cages and shot up with psychedelic drugs to keep them from crying.
 
Yes, they do. Here are the months:
Jan 176
feb 324
Mar 155
Apr 175
May 244
Jun 213
Jul 157
1444

So you're not including the upward rivisions from may and june then. Should be 268 for may, and 248 for June.
 
Sorry, but no. I would not consider that to be a significant change in trajectory. Certainly not worth increasing the deficits or starting a trade war to obtain such a small blip. In fact, given that we were already pushing full employment before Trump took office what you're calling a change in trajectory could very easily be an economic bubble that will cause more long-term damage than it gives us.

If the unemployment rate keeps shrinking, then we are not pushing full employment.

Nobody even knows where full employment is.

Ummm... no sorry, but again these numbers are below what we saw in 2014 and 2015. You can talk about buybacks all you want, but the reality is that we're basically at full employment already. These numbers are fine, but they're nothing incredibly different than what we've seen over the last few years. In 2016 we had 4 months of job growth above 200k, including one above 300k. Bad weather in May of that year made it look less impressive.

Employment data is very noisey. You can't reach the conclusion you have reached by only looking at a few months; that doesn't make sense. NFP growth peaked in 2014 at 250K jobs; in 2016 the average was 195K; in 2017 the average was 185K; currently the average is 215K. I'm not sure how you are honestly trying to suggest that the trend hasn't changed. Under what basis?

So basically what we're seeing is that in Trump's first-year job creation fell off significantly. Likely not entirely his fault as most of Obama's policies were still in place, but likely naturally caused by the fact that we were approaching full employment and reducing our deficits further.

He might not have gotten everything he wanted, but Obama has enacted more economic legisation. ARRA and JOBS act being the main two.

Now we're back to numbers that are pretty similar and possibly still lower than we had towards the end of Obama's term, but we're running higher deficits to get there. I'd say best case scenario is that these are still normal numbers that haven't really been impacted by what Trump and Republicans are doing. The worst case scenario is that they're actually fuelling a little bit of a bubble again.

They're not similiar numbers. This single month might have been similiar to previously small numbers, but it doesn't make sense to look at a single month in a snapshot. Majority of the reports this year were revised upward; this month might also be revised upward.
 
I don't think anyone is making that argument; the narrative that the economy was operating normally in 2014/2015 is not correct.
But the argument that it's operating normally today isn't either. So all you're telling me is that the unusual measures that Obama and the Fed were taking in 2014/2015 were better than the unusual measures Trump and Republicans are taking today.

The point is that the economy still isn't operating normally, which is why there is so much slack. Stimulus is a good way of mitigating slack.

I'm not seeing this slack you speak of. I see numbers naturally lowering because we're approaching full employment. In fact, the more I look at it you could likely explain some of the last years drop off with bad weather problems in March and September. So far this year excessive heat is the only weather event we seem to be having, and that's unlikely to affect employment negatively.
 
Nope. But he did build that beautiful unemployment slide trump is riding down.

Unemployment slides down for good reasons and bad reasons. If there is still slack in our labor market, then the unemployment rate was sliding down for bad reasons.
 
But the argument that it's operating normally today isn't either. So all you're telling me is that the unusual measures that Obama and the Fed were taking in 2014/2015 were better than the unusual measures Trump and Republicans are taking today.

No, it's that the measures didn't seem to work or had undesirable effects.

I'm not seeing this slack you speak of. I see numbers naturally lowering because we're approaching full employment. In fact, the more I look at it you could likely explain some of the last years drop off with bad weather problems in March and September. So far this year excessive heat is the only weather event we seem to be having, and that's unlikely to affect employment negatively.

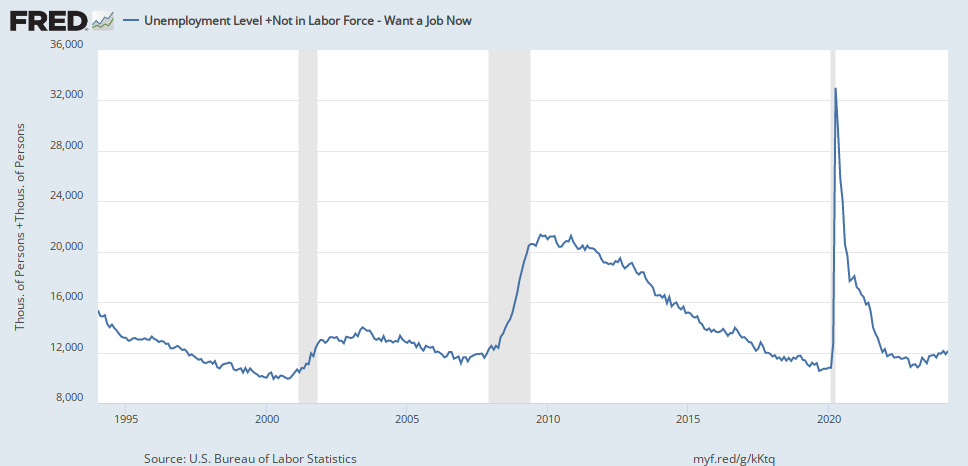
Here is one measure of slack: the number of people who currently are unemployed and/or the number of people who are not in the labor force, but would like to have a job. That is nearly 12 million people.

fredgraph.png
 
If the unemployment rate keeps shrinking, then we are not pushing full employment.
The unemployment rate isn't shrinking it's fluctuating. It was down to 3.8 earlier in the year. It went back up to 4.0, and now it's down to 3.9 again.

Employment data is very noisy. You can't reach the conclusion you have reached by only looking at a few months; that doesn't make sense. NFP growth peaked in 2014 at 250K jobs; in 2016 the average was 195K; in 2017 the average was 185K; currently, the average is 215K. I'm not sure how you are honestly trying to suggest that the trend hasn't changed. Under what basis?
Under the basis that 215k is somewhere in between the high of 250k and the low of 185k. So it's well within the ranges we've seen recently. Not to mention the fact that the poor numbers in 2016 were almost certainly caused by bad weather in May. That's likely the case in part for 2017 as well.

They're not similar numbers. This single month might have been similar to previously small numbers, but it doesn't make sense to look at a single month in a snapshot. Majority of the reports this year were revised upward; this month might also be revised upward.

I'm looking at 7 months, and that changes nothing about what I said. I expect somewhat smaller numbers as we approach full employment. This bump over the last couple of years tells me one of two things. Either A.) the last two years were hurt by bad weather and this year's numbers are closer to the normal average or B.) this bump may actually be an indication of a small bubble.
 
No, it's that the measures didn't seem to work or had undesirable effects.
That's pretty much exactly what I said.

Here is one measure of slack: the number of people who currently are unemployed and/or the number of people who are not in the labor force, but would like to have a job. That is nearly 12 million people.

The U-6 rate has historically always been a little less than double whatever the official rate is. In fact, the last time the official rate was this low was back in 2000. At that point the U-6 rate was about a .5% lower than it is right now, and that immediately preceded the 2000-2001 recession. The big difference there was that at the time we were running a surplus so when the economy got in trouble we had a little bit of wiggle room even though Bush and Republicans at that time used the wiggle room poorly.
 
The unemployment rate isn't shrinking it's fluctuating. It was down to 3.8 earlier in the year. It went back up to 4.0, and now it's down to 3.9 again.

When Trump started the UE rate was 4.8%; the point is that if it could potentially go lower, then we aren't at full employment. It could be 3.8%; it would be slightly higher. We don't know.

Under the basis that 215k is somewhere in between the high of 250k and the low of 185k. So it's well within the ranges we've seen recently. Not to mention the fact that the poor numbers in 2016 were almost certainly caused by bad weather in May. That's likely the case in part for 2017 as well.

I remember how the weather was always a convenient excuse for poor economic performance, but there is no evidence to suggest that this is true. The number of people who missed work due to the weather is smaller than the number of people who missed work due to Hurriance Sandy. It doesn't hold water...

https://www.bls.gov/opub/ted/2017/work-absences-due-to-bad-weather-from-1994-to-2016.htm

I'm looking at 7 months, and that changes nothing about what I said. I expect somewhat smaller numbers as we approach full employment. This bump over the last couple of years tells me one of two things. Either A.) the last two years were hurt by bad weather and this year's numbers are closer to the normal average or B.) this bump may actually be an indication of a small bubble.

We're not in a bubble. We might see smaller numbers; but right now the numbers are different. That is difficult to deny; unless you just want to lie to yourself.
 
That's pretty much exactly what I said.


The U-6 rate has historically always been a little less than double whatever the official rate is. In fact, the last time the official rate was this low was back in 2000. At that point the U-6 rate was about a .5% lower than it is right now, and that immediately preceded the 2000-2001 recession. The big difference there was that at the time we were running a surplus so when the economy got in trouble we had a little bit of wiggle room even though Bush and Republicans at that time used the wiggle room poorly.

This isn't U-6, this is just Unemployed Person and people who are Not in the Labor Force but Want a Job. U-6 has Marginally Attached Workers and people who are Part-Time for Economic Reasons, which is a measure of labor underutilization and isn't the best measurement of slack.

And how should the Republicans used that "wiggle room". A terrorist attack happened; people refused to spend; financial markets weren't lending. What can you do in that scenario?
 
Seems to me all those critical lefties clamoring for minimum wage, guaranteed employment and universal income should just shut up and get back to work.
 
157,000 is among the lowest for 2018. Overall, job gains are nothing special to write home about. These are YTD figures for the last few years:

2012.....1,258
2013.....1,316
2014.....1,682
2015.....1,611
2016.....1,413
2017.....1,291
2018.....1,444

So tell me when do we reach full employment in the liberal world in which you live?? Just another bad day for radicals and loving it

Labor Force Statistics from the Current Population Survey
Original Data Value

Series Id: LNS12000000
Seasonally Adjusted
Series title: (Seas) Employment Level
Labor force status: Employed
Type of data: Number in thousands
Age: 16 years and over
Years: 2008 to 2018

Year Jan Feb Mar Apr May Jun Jul Aug Sep Oct Nov Dec
2008 146378 146156 146086 146132 145908 145737 145532 145203 145076 144802 144100 143369
2009 142152 141640 140707 140656 140248 140009 139901 139492 138818 138432 138659 138013
2010 138438 138581 138751 139297 139241 139141 139179 139438 139396 139119 139044 139301
2011 139250 139394 139639 139586 139624 139384 139524 139942 140183 140368 140826 140902
2012 141584 141858 142036 141899 142206 142391 142292 142291 143044 143431 143333 143330
2013 143292 143362 143316 143635 143882 143999 144264 144326 144418 143537 144479 144778
2014 145122 145161 145673 145680 145825 146267 146401 146522 146752 147411 147391 147597
2015 148113 148100 148175 148505 148788 148806 148830 149136 148810 149254 149486 150135
2016 150576 151005 151229 150978 151048 151164 151484 151687 151815 151939 152126 152233
2017 152076 152511 153064 153161 152892 153250 153511 153471 154324 153846 153917 154021
2018 154430 155215 155178 155181 155474 155576 155965

Let's see, pre recession employment was 146 million, when Obama left office it was 152 million or 6 million gain in 10 years, today we have 155.9 million or almost 3.9 million jobs created in 1 1/2 years. Tell me again how successful Obama's term was?

Another factor you want to ignore, part time for economic reasons meaning people are FINDING FULL TIME JOBS

Labor Force Statistics from the Current Population Survey
Original Data Value

Series Id: LNS12032194
Seasonally Adjusted
Series title: (Seas) Employment Level - Part-Time for Economic Reasons, All Industries
Labor force status: Employed
Type of data: Number in thousands
Age: 16 years and over
Hours at work: 1 to 34 hours
Reasons work not as scheduled: Economic reasons
Worker status/schedules: At work part time
Years: 2008 to 2018

Year Jan Feb Mar Apr May Jun Jul Aug Sep Oct Nov Dec
2008 4846 4902 4904 5220 5286 5540 5930 5851 6148 6690 7311 8029
2009 8046 8796 9145 8908 9113 9024 8891 9029 8847 8979 9114 9098
2010 8530 8936 9233 9178 8845 8577 8500 8800 9246 8837 8873 8935
2011 8470 8464 8645 8652 8576 8427 8281 8788 9166 8657 8447 8171
2012 8305 8238 7775 7913 8101 8072 8082 7974 8671 8203 8166 7943
2013 8151 8178 7722 7964 7937 8103 8099 7816 7764 7936 7718 7827
2014 7302 7304 7451 7516 7260 7425 7400 7169 7007 7031 6885 6817
2015 6820 6693 6653 6622 6643 6386 6234 6411 6025 5807 6159 6027
2016 5960 6021 6099 6027 6491 5751 5898 5977 5893 5955 5719 5554
2017 5776 5670 5500 5309 5268 5264 5236 5209 5148 4880 4851 4915
2018 4989 5160 5019 4985 4948 4743 4567
 
When Trump started the UE rate was 4.8%; the point is that if it could potentially go lower, then we aren't at full employment. It could be 3.8%; it would be slightly higher.
A tenth of a percentage point doesn't seem like much, so this variation may not be important. It presumably indicates variations in the number of people looking for work, it would be affected by changes in the size of the labor force (people retiring and become adults).
 
So tell me when do we reach full employment in the liberal world in which you live?? Just another bad day for radicals and loving it


Let's see, pre recession employment was 146 million, when Obama left office it was 152 million or 6 million gain in 10 years, today we have 155.9 million or almost 3.9 million jobs created in 1 1/2 years. Tell me again how successful Obama's term was?

Another factor you want to ignore, part time for economic reasons meaning people are FINDING FULL TIME JOBS

I think economist believe 4% is the floating area for full employment. ICBWT
 
Seems to me all those critical lefties clamoring for minimum wage, guaranteed employment and universal income should just shut up and get back to work.

I am at work. I'm just so efficient at my job I can afford to spend some downtime educating you. What's your excuse for being online at 1 o'clock on a Friday?
 
And how should the Republicans used that "wiggle room". A terrorist attack happened; people refused to spend; financial markets weren't lending. What can you do in that scenario?

Put more money in the hands of low-income people who are living paycheck to paycheck. They have no choice, but to spend and if Bush's tax cuts would have focused on them or he would have used it on infrastructure it would have been far more useful. Instead, he gave it to wealthy people with disposable income. They already had money laying around which they had the option to spend, but as you pointed out they were refusing to do so. That's why a tax cut for the rich didn't work well. Instead if fuelled reckless investments by wealthy people who had too much money laying around. Those reckless investments fuelled a bubble that blew up in our faces, and I fear that is precisely what Trump's cuts are doing today.
 
Unemployment rate is the lowest it's been for this century, so what's the problem?
This is Trump's economy. Deal with it...
 
Majority of the job gains this month was in manufacturing, leisure and hospitality wholesale trade and health care. Also temporary services ticked up again after two consecutive months of job losses in that industry. Not sure what that's about...

Screen-Shot-2018-08-03-at-8.40.29-AM-e1533300969329.png


Jobs for the month of July were revised upward from 213K to 243K.

Screen-Shot-2018-08-03-at-8.53.44-AM.png


The unemployment rate dipped below 4.0% again, showing signs that there is still slack in the labor market.

2018-08-03%20%283%29.jpg

Anyone know why trumps first year job creation was the worst in 6 years?
And
2017<2016<2015?
And this huge growth happened for 74 months under Obama, continued for 18 months under don the con?
 
Back
Top Bottom