• This is a political forum that is non-biased/non-partisan and treats every person's position on topics equally. This debate forum is not aligned to any political party. In today's politics, many ideas are split between and even within all the political parties. Often we find ourselves agreeing on one platform but some topics break our mold. We are here to discuss them in a civil political debate. If this is your first visit to our political forums, be sure to check out the RULES. Registering for debate politics is necessary before posting. Register today to participate - it's free!

U.S. government posts $49 billion surplus in January

I agree with you here. I don't have time to do the research right now, but I'd be curious as to how much revenue the Treasury collected the month prior (Dec, 2017) or even 1-year ago just to do an accurate comparison. Seems to me the surplus might not be in receipts but rather in outlays...we spent more, but collected relatively the same amount of revenue. Of course, having a $49B surplus the month proceeding a tax reform measure gives the impression that tax reform (reductions) spearheaded revenue growth. Until I see a monthly/annual comparison on receipts and outlays, I'm hesitant to give the Trump tax cuts the credit many believe they deserve.

Those numbers you seek are right in the OP.

https://www.fiscal.treasury.gov/fsreports/rpt/mthTreasStmt/mts.pdf
 
More good news that the usual suspects will ignore.

Obama's January 2017 surplus - $51,257M
Trump's January 2018 surplus - $49,236M

So Obama's is bigger! :2rofll:

Here's a bucket for your fail. :failpail:
 
Obama's January 2017 surplus - $51,257M
Trump's January 2018 surplus - $49,236M

So Obama's is bigger! :2rofll:

Here's a bucket for your fail. :failpail:

It defies reality. He's on an alternative fact hunt.
 
You make yourself look stupid for posting as if you are wholly ignorant of the reality that we've always increased government revenues, even when tax cuts have occurred and that the only thing so far that has ever lowered government revenues is a sputtering or weak economy (i.e. recessions, bubbles popping).

The irony meter just exploded: https://www.whitehouse.gov/omb/historical-tables/ Table 2.1

Individual income tax receipts:
2000 1,004,462
2001 994,339
2002 858,345
2003 793,699
2004 808,959
2005 927,222

Second, the comment to which you replied referred to policies that increase the BUDGET DEFICIT, which is a pretty specific claim. You replied, stupidly, with a comment on the tendency for nominal government receipts to rise over time even with tax rate cuts, which is true (inflation, economic growth, population growth all mean that over time nominal revenues will increase). But that does not prove, imply, or even suggest that the tax cuts do not result in revenue lower than would have been the case at the old rates, which given the same level of spending WILL INCREASE THE DEFICIT.

To believe otherwise is to believe in a free lunch, that there are no hard choices in tax policy - we can hand out the candy and cake of tax cuts, and either keep spending the same or even increase spending because of MAGIC! It's nonsense of course. Lower tax rates mean smaller government, less spending, OR bigger budget deficits.

Bottom line is economists are roughly 100% in agreement - tax rate cuts reduce revenues from the baseline, or what would have been collected under the old rates. Doesn't matter whether the economists are liberal, conservative, love tax cuts, hate them, favor them or oppose them. The data are clear - tax rate cuts reduce revenue, and without spending cuts WILL increase the deficit. The possible exception highlighted by the so-called Laffer Curve are at rates roughly double current rates.
 
Interest rates are going up because the economy is doing too well.

Sort of. We were at full employment more or less, then the GOP enacted or will enact $100s of billions in old fashioned Keynesian stimulus in an economy doing well. So the Fed sees that, and the additional borrowing resulting from the tax cuts and $300B in extra spending, as inflationary, and are raising rates as a result.
 
For once in 8 years I am reading an article where the Fed doesn't have to keep lending rates at 0. For the first time in 8 years I am reading about a surplus in expected receipts at Treasury....I'm hearing of higher wages, I am hearing of companies giving bonuses....I am hearing of companies bringing their offshore money back, and of expanding operations in the US creating real jobs...Need I go on?

It's good news.

The problem is, if you were paying attention, you'd have been reading about those monthly surpluses in January, April, June and September every year on a regular basis in the past few Obama years. Someone posted a graph earlier that showed this clearly. So it's not new, has nothing at all to do with Trump or his policies or the economy and it tells us really nothing at all about the path of future deficits and debt. It's one number, meaningless in this context.

It's also true that the economy and the stock market have been improving for YEARS now. What's new is a President and his minions taking credit every month for news we've essentially been seeing for more than 5 years now. The budget deficit has come down regularly, employment up, wages in the 2016 took a significant jump up, stock market on a years' long tear, etc. This is all nothing new. What's new is the partisan spin on it.
 
The irony meter just exploded: https://www.whitehouse.gov/omb/historical-tables/ Table 2.1

Individual income tax receipts:
2000 1,004,462
2001 994,339
2002 858,345
2003 793,699
2004 808,959
2005 927,222

Lol...I love it when people are wrong. We've been reducing taxes for decades now and yet we have always gone up except for, as I pointed out, when we've had economic issues (e.g. dot com bubble, housing bubble). That remains 100%, despite you trying to use improper numbers.

https://www.thebalance.com/current-u-s-federal-government-tax-revenue-3305762

FY 2017 (est.) - $3.460 trillion.
FY 2016 - $3.268 trillion.
FY 2015 - $3.250 trillion.
FY 2014 - $3.021 trillion.
FY 2013 - $2.775 trillion.
FY 2012 - $2.45 trillion.
FY 2011 - $2.3 trillion.
FY 2010 - $2.16 trillion.
FY 2009 - $2.1 trillion.
FY 2008 - $2.52 trillion.
FY 2007 - $2.57 trillion.
FY 2006 - $2.4 trillion.
FY 2005 - $2.15 trillion.
FY 2004 - $1.88 trillion.
FY 2003 - $1.72 trillion.
FY 2002 - $1.85 trillion.
FY 2001 - $1.99 trilion.
FY 2000 - $2.03 trillion.
FY 1999 - $1.82 trillion.
FY 1998 - $1.72 trillion.
FY 1997 - $1.58 trillion.
FY 1996 - $1.45 trillion.
FY 1995 - $1.35 trillion.
FY 1994 - $1.26 trillion.
FY 1993 - $1.15 trillion.
FY 1992 - $1.09 trillion.
FY 1991 - $1.05 trillion.
FY 1990 - $1.03 trillion.
FY 1989 - $991 billion.
FY 1988 - $909 billion.
FY 1987 - $854 billion.
FY 1986 - $769 billion.
FY 1985 - $734 billion.
FY 1984 - $666 billion.
FY 1983 - $601 billion.
FY 1982 - $618 billion.
FY 1981 - $599 billion.
FY 1980 - $517 billion.
FY 1979 - $463 billion.
FY 1978 - $399 billion.
FY 1977 - $356 billion.
FY 1976 - $298 billion.
FY 1975 - $279 billion.
FY 1974 - $263 billion.
FY 1973 - $231 billion.
FY 1972 - $207 billion.
FY 1971 - $187 billion.
FY 1970 - $193 billion.
FY 1969 - $187 billion.
FY 1968 - $153 billion.
FY 1967 - $149 billion.
FY 1966 - $131 billion.
FY 1965 - $117 billion.
FY 1964 - $113 billion.
FY 1963 - $107 billion.
FY 1962 - $100 billion.
FY 1961 - $94 billion.
FY 1960 - $93 billion.
 
The point of the original post was that the surplus is a good sign, and it is a good sign given all the hand wringing over lost revenue from the tax cuts. In the first month of receipts with the new tax plan there seems to be little change to revenue.

With all that did change, it would take one helluva complicated analysis to figure out what if any effect the new plan had on receipts, with most of changes only affecting income earned in 2018 or later. A dozen or more major moving parts to that analysis, affecting revenues and expenditures.
 
Lol...I love it when people are wrong. We've been reducing taxes for decades now and yet we have always gone up except for, as I pointed out, when we've had economic issues (e.g. dot com bubble, housing bubble). That remains 100%, despite you trying to use improper numbers.

What about my numbers was improper? We passed two big individual tax cuts under Bush, and nominal individual income tax revenues WENT DOWN. If you want to tell me how numbers that dropped, after tax cuts, support the idea that tax revenues do NOT go down following tax cuts, then do the analysis for me. Bring in GDP, inflation, population growth, etc. which you'll need to do to prove your point. Otherwise, the data are clear enough - Bush tax cuts ===> lower revenue. Your own data support that conclusion.

Also, too, I've learned you like to snip comments you can't address, so I'll repeat the part of my post you ignored. Address it if you want, but I see no need to repeat myself.

Second, the comment to which you replied referred to policies that increase the BUDGET DEFICIT, which is a pretty specific claim. You replied, stupidly, with a comment on the tendency for nominal government receipts to rise over time even with tax rate cuts, which is true (inflation, economic growth, population growth all mean that over time nominal revenues will increase). But that does not prove, imply, or even suggest that the tax cuts do not result in revenue lower than would have been the case at the old rates, which given the same level of spending WILL INCREASE THE DEFICIT.

To believe otherwise is to believe in a free lunch, that there are no hard choices in tax policy - we can hand out the candy and cake of tax cuts, and either keep spending the same or even increase spending because of MAGIC! It's nonsense of course. Lower tax rates mean smaller government, less spending, OR bigger budget deficits.

Bottom line is economists are roughly 100% in agreement - tax rate cuts reduce revenues from the baseline, or what would have been collected under the old rates. Doesn't matter whether the economists are liberal, conservative, love tax cuts, hate them, favor them or oppose them. The data are clear - tax rate cuts reduce revenue, and without spending cuts WILL increase the deficit. The possible exception highlighted by the so-called Laffer Curve are at rates roughly double current rates.

The bolded go directly to your original comment. The claim was about the deficit. You're insisting we discuss nominal revenues. Those are different, and ignoring someone pointing out your dishonest shift of the goal posts is hackery.
 
Last edited:
And it has been since 2014. The rest of your post is regurgitated partisan trash, and doesn't warrant a response.

Boosted by part time jobs for economic reasons that skew the employment number up but that doesn't bother you just like the electorate recognizing the true problem and giving the Congress to the Republicans
 
Your interpretation of the economy is based on a bull**** partisan agenda. Look, i get that you don't want to be held accountable for your previous posts. Hence, nobody respects you.

Your book smart arrogance and street stupid comments speak volumes about you and show why you will continue to lose elections. Nobody respects me? When was that poll taken? You have that typical leftwing arrogance and zero credibility
 
He is incapable of understanding the difference between deficit and debt, even though it has been explained to him (in great detail) on multiple occasions.

The taxpayers in this country pay debt service on the debt, not the deficit but it is the deficits that create the debt. Your ignorance of reality is staggering
 
What about my numbers was improper?.

You cherry picked only a portion of government revenues, not the overall total revenues. I gave you the real numbers. You're welcome.
 
What the hell is wrong with you people, celebrate the surplus and then IF it happens that the deficits grow you can have your say. Negativity is all you people have and that is why you will continue to lose elections

Conservative suggesting that someone cherry picks data.

9b7irzr13ah3rdkf88hc_400x400.jpg
 
Boosted by part time jobs for economic reasons that skew the employment number up but that doesn't bother you just like the electorate recognizing the true problem and giving the Congress to the Republicans

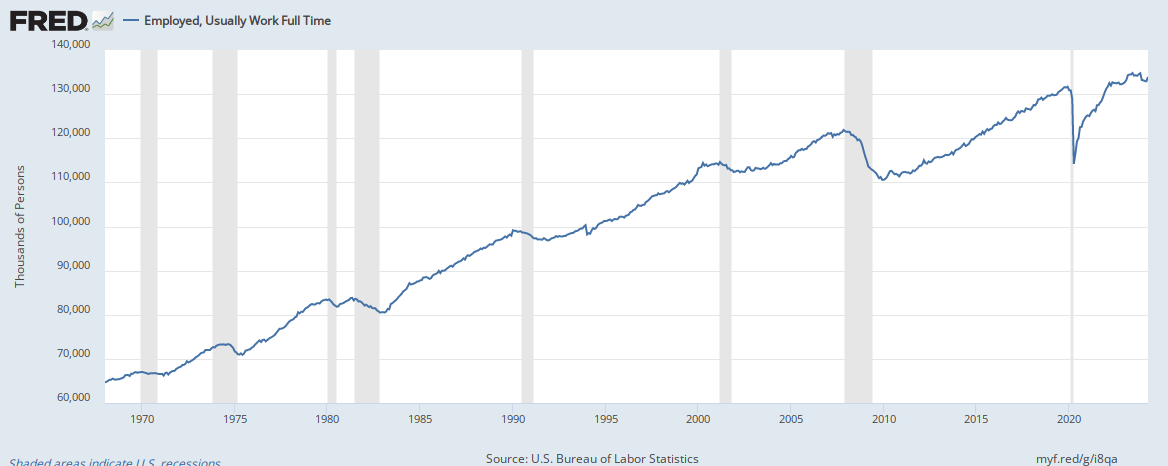
Fourteen million full time jobs were created during the Obama administration.

fredgraph.png
 
Nobody respects me?

Nobody respects you or your opinion. One reason why is sheer hypocrisy; deficits and debt are (not surprisingly) irrelevant now.
 
The taxpayers in this country pay debt service on the debt, not the deficit but it is the deficits that create the debt. Your ignorance of reality is staggering

Why does the debt often increases more so than the deficit?
 
You cherry picked only a portion of government revenues, not the overall total revenues. I gave you the real numbers. You're welcome.

And your numbers showed a drop in revenues. If you want to claim it's because of the recession, show your work. BTW, here are total government revenues adjusted for inflation. Table 1.3 at this link: https://www.whitehouse.gov/omb/historical-tables/

2000 2,541.0
2001 2,433.2
2002 2,227.6
2003 2,083.6
2004 2,141.8
2005 2,371.6
2006 2,561.9

Also, you keep ignoring my comments. Here's the key one again. Thanks in advance for addressing it.

Second, the comment to which you replied referred to policies that increase the BUDGET DEFICIT, which is a pretty specific claim. You replied, stupidly, with a comment on the tendency for nominal government receipts to rise over time even with tax rate cuts, which is true (inflation, economic growth, population growth all mean that over time nominal revenues will increase). But that does not prove, imply, or even suggest that the tax cuts do not result in revenue lower than would have been the case at the old rates, which given the same level of spending WILL INCREASE THE DEFICIT.

To believe otherwise is to believe in a free lunch, that there are no hard choices in tax policy - we can hand out the candy and cake of tax cuts, and either keep spending the same or even increase spending because of MAGIC! It's nonsense of course. Lower tax rates mean smaller government, less spending, OR bigger budget deficits.

Bottom line is economists are roughly 100% in agreement - tax rate cuts reduce revenues from the baseline, or what would have been collected under the old rates. Doesn't matter whether the economists are liberal, conservative, love tax cuts, hate them, favor them or oppose them. The data are clear - tax rate cuts reduce revenue, and without spending cuts WILL increase the deficit. The possible exception highlighted by the so-called Laffer Curve are at rates roughly double current rates.

Pay particular attention to the bolded. No one gives a damn about nominal revenues, the claim to which you responded was about DEFICITS, which is different than revenues. Thanks.
 
You cherry picked only a portion of government revenues, not the overall total revenues. I gave you the real numbers. You're welcome.

See my other reply. But I'll address this separately. Your claim was about tax cuts and the impact of them on tax revenues, and to prove your point you insist that we include total government revenues including SS and Medicare payroll tax revenues. Why would we do that?

The wage base for SS increased from $80,400 in 2001 to 106,800 in 2009, and rates didn't change. So we had an effective > 25% increase in the wages subject to SS at the top - that's aka a tax increase. So you're including Bush-era tax increases for payroll taxes to prove that individual income tax rate cuts don't cause tax revenue to drop.

That's intellectually dishonest hackery, or ignorance. Either one doesn't make your analysis look all that hot. It's like doing an analysis of the effect of advertising on sales of TVs, then lumping in sales of automobile snow tires from another subsidiary to the sales figures for your TVs. Pretty dumb, right. So why do you think you can get away with it in this case?

The reason I "cherry picked" individual income tax revenues is because the Bush tax cuts affected individual income tax rates. So I was comparing apples to apples. What you're doing is comparing apples to apples plus cherries plus pecans plus chocolate chips.
 
Last edited:
Back
Top Bottom