WallStreetVixen
Well-known member
- Joined
- Oct 7, 2014
- Messages
- 715
- Reaction score
- 131
- Location
- New York City/London
- Gender
- Female
- Political Leaning
- Other
I suggest you revisit the indentation in your link
Okay? What did I miss?


I suggest you revisit the indentation in your link
First, the BLS's 'creative math', Birth/Death model accounted for roughly 132,000 of that total. That latter number is NOT part of the business survey, it is a guesstimate from the BLS added on to the final survey number.
http://www.bls.gov/web/empsit/cesbd.htm
Second, the Household survey showed only 96,000 more Americans employed. The only reason the unemployment rate went down was because a whopping 354,000 left the labor force.
http://www.bls.gov/news.release/empsit.a.htm
Thirdly, the Part time/Full time section shows only 48,000 more Americans working.
http://www.bls.gov/news.release/empsit.t09.htm
These are not the signs of healthy employment growth.
Does it? Let's think.
IT is overhead. No one likes paying for overhead. I'm fairly confident companies would prefer to spend as little as they can on IT, and automate as much IT as possible.
Manufacturing employment has been shrinking as a percentage of the US workforce since the 1950s, and is now down to around 10%. It's an industry that is increasingly outsourced and automated. Manufacturers vastly prefer to drive down costs, if they can do so while maintaining or improving quality. And "more manufacturing output" is only truly beneficial if it meets an existing need.
We should also note that manufacturing is, again, a means rather than an ends. If the hotel doesn't have guests, it won't buy those tiny little shampoos, which means the manufacturer won't profit by producing tiny shampoo bottles, which means that company won't order raw supplies from its vendors. See how it all fits together? Or should manufacturers only sell products for uses that enhance productivity? :mrgreen:
Do we really need to spend more on health care? Seriously?
Do we really need more lawyers? Seriously?
Do you want more jobs for bankers, because BofA, Citi and JPM whacked 50,000 employees off the rolls in January? (How many of those jobs were automated out of existence by IT systems?)

I heartily agree we need to improve education, and I'm confident that hiring more teachers and paying them more is very likely a component of that. Just for the record, I don't think we should improve education in order to enhance GDP.")
Why do you think you should earn anything without doing something of value? It's rediculous to think that you can just save your money in a savings account or in low risk bonds and make a profit over the inflation rate, you should just be thankful that you got 0.99% last year because inflation was only 0.7%. Expecting to get something for doing nothing is the entitlement mentality, and people who have such expectations are just as bad as welfare slackers.
Long term historically, people never made a profit on low risk savings. Back in the olden days, when people tried to "save" their production, it rotted or was eaten by vermin and thus it lost value over time. Consider yourself fortunate that we live in the day when you can trade your production for the US dollar and put that dollar in a nearly risk free savings account and not lose your savings.
If you expect higher yields, then you should try INVESTING instead of just savings. Our economy doesn't really need your savings, it's pointless and has no value. The fed can produce unlimited amounts of money out of thin air. What we do need are entrapanures and wise investors - people who will put money to work, instead of sitting in their easy chair expecting their money just to magically grow without risk or personal effort.
And? Why do you consider that an issue? Why is it done and is it inaccurate and if so, which way? Before you respond, be aware that the actual changes due to business births and deaths are known from the Quarterly Census of Employment and Wages (up to March 2014) and can be compared to the forecasts used. And note that while espessially for 2009 the birth/death model was way off (overestimated job gains by over 700,000) the methodology has been updated since then.First, the BLS's 'creative math', Birth/Death model accounted for roughly 132,000 of that total. That latter number is NOT part of the business survey, it is a guesstimate from the BLS added on to the final survey number.
http://www.bls.gov/web/empsit/cesbd.htm
That's 96,000 plus or minus 399,614 (http://www.bls.gov/cps/eetech_methods.pdf using table 1-D, 90% confidence If you can't do the math, I'll walk you through it.)Second, the Household survey showed only 96,000 more Americans employed.
Except that link shows that the labor force went down 178,000, not 354,000 You didn't even have to do math because it's in the table.The only reason the unemployment rate went down was because a whopping 354,000 left the labor force.
http://www.bls.gov/news.release/empsit.a.htm
Despite a large amount of jobs being vacant in the economy, people refuse to take them. 2013 created less employment than 2012. 2014 rolls along, and not only did it create the most jobs in the entire expansion, but it also created jobs at the fastest rate since the 90s. This is because congress failed to extend unemployment benefits in December 2013. This forced millions of people that were collecting checks to search for work.
I did something of value. I provided liquid capital to a bank for them invest in other projects. For a guaranteed return, they own the risk and the reward.
Banks don't need your deposits to have money to lend. They can lend first, and then acquire the money overnight. When they lend, the deposit that is generated from the lending automatically supplies the money that they need to acquire.
Regardless, interest is the price of money. In the real world, things are priced according to supply and demand. Things that are cheap to produce and are in ample supply don't cost much. Money can be created at virtually no cost by the fed and in unlimited supply, so there is no reason for the price of money to be high - it should be almost free, thus ZIRP (zero interest rate policy) makes a lot of sense and is perfectly normal and sustainable.
You did nothing of value. You should have made the effort to invest money into something productive, like start a business, or directly fund (taking substantial risk) a business. Even spending your money on consumer goods would have been more productive because spending increased demand, which results in increased production.
I thought it was the other way around.Banks ... are only allowed to loan out a % of their deposits.
Banks only get funding via that process when there is a temporary funding problem. They are only allowed to loan out a % of their deposits.
Since the liberals have a made it comfortable to ride the entitlement deadbeat-wagon, more Americans are doing just that rather than working,......ie so the jobless rate drops. Do you REALLY think that is a benefit to society? The job participation rate is at a 40 plus year low, it is even worse for women and minorities, food stamps, welfare and all the other entitlements have historical high usage, both in numbers and percentage of population. Is that REALLY progress in the mind of a progressive grubercrat?
I've never seen a study on it, but it raises an interesting question: would a dollar spent on something with a 3% profit margin result in different velocity than a dollar spent on something with a 20% profit margin.
All economic choices, including resource allocation, have tradeoffs (opportunity costs) on account of scarcity. Furthermore asymmetric information (imperfect information and/or differing access to information) coupled with uncertainty impose their own inefficiencies. Moreover, the context in which companies operate is dynamic. Hence, what might appear to be an optimal choice today, might well be suboptimal for the long-term. For example, consider the case of a company determining how to allocate its resources. For purposes of simplicity, let's just assume it has $1 billion available for investment into only two possibilities (1) a product with steady growth in sales and a profit margin of 20% per unit and, (2) another product with uncertain growth in sales, a limited customer base, and little if any profit margin. What choice should the company make?
The rational answer would appear to be that it should not waste its capital and, therefore, it should plow its investment into the first product to maximize its profits and shareholder welfare. But the empirical evidence across industries is not so clear-cut on account of the factors that I mentioned earlier e.g., uncertainty.
There are numerous cases where the inferior product that was passed up established firms but embraced by newer ones, evolved into a high value product over time with value that matched or exceeded that produced by the high value product(s) embraced by the established companies. Moreover, the newer companies that chose to invest in the development of such products wound up with lower cost structures on account of efficiencies driven by trying to survive while the more established firms had less competitive cost structures that evolved from their paying less attention to costs from their being accustomed to selling high value products. In time, those once inferior products wound up becoming disruptive technologies.
Suddenly what had seemed to be the rational choice to invest in the more profitable product, was actually the suboptimal cost. Instead of promoting shareholder welfare, the seemingly rational choice undermined it in the long-term. Many firms when confronted by such disruptive technologies have declined or disappeared with significant and even total destruction of shareholder wealth.

Economics One | A blog by John B. Taylor
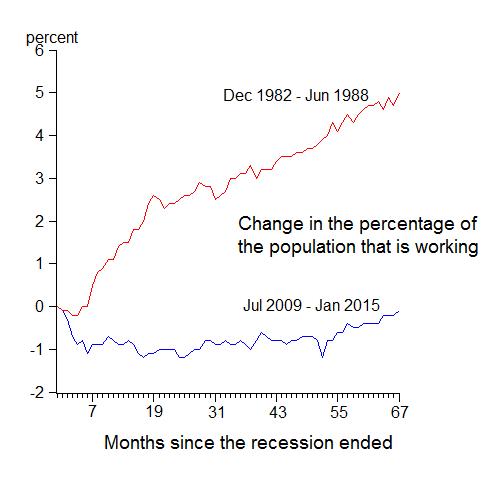
One year after recovery started (2010) was pathetic compared to prior recoveries - weaker than all the other deep recessions in American history. In 2011 it was so weak so as to be non-existent. By 2012 it was the worst three year recovery in US history. In 2013 was still unusually weak, so weak that Obama's guy, Larry Summers’, defined it as “secular stagnation” .In 2014 it was still a not so great recovery, till late in the year when if FINALLY acted more like a normal recovery. So now, as we approach year 6, we are showing some robust signs in job growth.
Even so, the recovery is not where it should be. Four quarters of growth in 2014 looks to average only 2.2% compared with 4.4% in the corresponding quarters of the 1980s recovery. And as of January 2015 the employment-to-population ratio is still lower than at the start of the recovery.
It's good that we are finally showing some real recovery, but that does not undue the lost output from years of needless stagnation from mutton-headed administration "management".
I'll add briefly to your point about the demand for positions, as there is a broader context. There was also an increase in the supply of positions (job openings) especially from 2013 and afterward. For a quick sketch, the JOLTS data showed 3.612 million openings in December 2012, 3.914 million openings in December 2013 and 5.028 million openings in December 2014. The number of openings increased notably as household deleveraging finally ended in 2013 as revealed by data among the Federal Reserve's Financial Accounts report, among other sources.
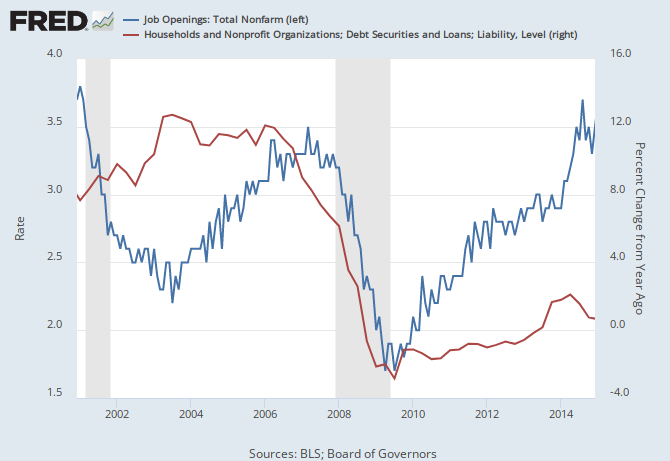
The end of household deleveraging contributed to an increase in aggregate demand, certain sectors could no longer accommodate that increase in demand via productivity gains, and the demand among employers for labor (supply of positions for potential employees) picked up as evidenced in the JOLTS data. Of course, some of the data is still subject to revision, but it appears that the revisions would need to be fairly large to materially change the general themes noted above.

Since the liberals have a made it comfortable to ride the entitlement deadbeat-wagon, more Americans are doing just that rather than working,......ie so the jobless rate drops. Do you REALLY think that is a benefit to society? The job participation rate is at a 40 plus year low, it is even worse for women and minorities, food stamps, welfare and all the other entitlements have historical high usage, both in numbers and percentage of population. Is that REALLY progress in the mind of a progressive grubercrat?
Job openings increased all throughout the recovery... The economy went from a 1.6% job openings rate to 3.5% in December, the highest its been since 2001. I really don't see where you think was game changer between.
Households stopped deleveraging in July - Sept 2013, the third financial quarter. Last time I checked, that's not the end of 2013.
There was also no evidence that aggregate demand picked up. None.
You, for whatever reason, believe that the deleveraging resulted in an increase in aggregate demand.
Sure Eastman-Kodak is an example of that, but it really doesn't address the issue on the consumption side. Would me buying a bag of chips at 3% profit for Kroger for $1 be better or worse for the economy than me buying a pack of firecrackers for $1 at a 20% profit to the head shop.
While there may be shortcomings when personal utility, among other factors, shapes demand for various products/services, overall, a market economy where consumers freely make their own choices is vastly more effective across a broad range of measures than any alternative. This does not mean that there aren't limitations e.g., externalities. But overall, the economy is better (larger, more products/services, etc.) than what would be seen under any alternative that has been devised to date.
Sure, but still doesn't address the issue. Let me try to rephrase it, does it matter what we spend our money on as long as we are spending it on something, and if so, how do we plan for that? (I'll give you a clue to why I ask: leaky buckets)
Both the rate of employment growth and number of job openings picked up, especially later in the recovery. My point is that one saw both supply and demand-side factors involved in employment outcomes e.g., falling unemployment rate.
I wrote "ended in 2013" not "end of 2013."
If one looks only at quarterly fluctuations, the volatility can hide the improvement that has taken place. If one looks at annual Real Personal Consumption Expenditures (PCE) one finds the following year-to-year growth:
2010 1.9%
2011 2.3%
2012 1.8%
2013 2.4%
2014 2.5%
Moreover, the annualized growth in real PCE from since the beginning of 2013 Q3 (through 2014 Q4) has been 2.8%.
In sum, the evidence that the end of household deleveraging contributed to an increase in aggregate demand is available so long as one cuts through the quarter-to-quarter volatility. Other factors are also involved.

(For those interested in running the numbers, the data can be found here: http://bea.gov/iTable/iTable.cfm?re...=1&904=2009&903=66&906=a&905=1000&910=x&911=0)
For those interested, the following is a good paper on household deleveraging: http://www.ecb.europa.eu/pub/pdf/scpwps/ecbwp1643.pdf. Although the paper goes beyond the impact of deleveraging on economic activity/consumption/labor market changes, it has some relevant information.
It states:
As we have shown in the last section of the paper, it seems that the extent of leveraging by households has indeed been correlated with economic performance across US states. In particular, high deleveraging states have experienced much sharper boom-bust cycles in house prices and increases in delinquency rates, while the labour market also had a worse performance. This topic remains a theme to be explored in future research.
The data shows it. The recent literature acknowledges it.
No question job numbers are multi-faceted, with some good news, some bad news, some troubling trends and some encouraging trends. Economic reports are complex.
I took issue with your rant that people are comfortable on welfare and that the labor participation rate, in and of itself, was some type of indictment on a soft economy.
No question that the U-3 is improving, but I do believe the U-6 number is more telling. I do believe the labor market is tightening (I see it first hand, as hiring qualified people is really hard for me right now, in a state where unemployment is under 4%), but that wages are stagnant (but that is 30 year trend, nothing new). I do question how strong our recovery really is.
I do not agree, however, that people are not in the job market because they would rather be on welfare. I generally think that is an ignorant position, for those that hold it. I also believe 90% of the people on this board have no clue about what the labor participation rate means and what constitutes "Not in the Labor Force". In spite of that ignorance, many of those 90% seem to have an opinion on something they are woefully uneducated about.