• This is a political forum that is non-biased/non-partisan and treats every person's position on topics equally. This debate forum is not aligned to any political party. In today's politics, many ideas are split between and even within all the political parties. Often we find ourselves agreeing on one platform but some topics break our mold. We are here to discuss them in a civil political debate. If this is your first visit to our political forums, be sure to check out the RULES. Registering for debate politics is necessary before posting. Register today to participate - it's free!

Payroll employment increases by 321,000 in November; unemployment rate unchanged

Sorry, we can't even agree on that.

QE has been largely unsuccessful. It's fairly inert. Exagerated monetary policy isn't an effective way to stimulate the economy. A little may good, but a whole bunch more is pointless. We have given the responsibility of managing our economy largely to the fed, but the fed only has one tool, and that's monetary policy. When the only tool you have is a hammer, every problem tends to look like a nail.

Fiscal policy (ie tax cuts for the consumer class) is a much more effective tool for managing a weak economy.


I didn’t say it was successful. I said: “QE has a major effect on our economy. “

If you bothered to read my post you will see that, IMO, “QE has not only been largely unsuccessful”, QE will be highly detrimental to our nation over time.
 
Much like federal judges, the President nominates and Congress approves members of the Fed for a specific time period. However, the POTUS has HUGE influence over policy shaping.


So let me see if I am hearing you correctly…

WRESBAL_Max_630_378.png


Are you saying this 4+ Trillion dollar pumping of money into our economy since Obama took office was Bush’s fault. Are you saying Obama is so weak that he, unlike every President since 1913, has no clout or leverage in the matter.


Oh Really. Is that because she has -all of a sudden- realized that all of her previous votes in favor of pumping were wrong? Or is it because she knows that QE has reached the danger level and now that the Obama Administration has made it through it’s last election cycle and the ill affects (stagflation) of backing off QE aren’t as big of a threat to his political party now?


In some perverted way, I can see why a biased defender of this Administration’s economic policies would make such a fringe statement…

But let’s try and look at it without an agenda. Obviously, QE has a major effect on our economy. That’s the reason behind doing it in the first place. Right? Can we agree on that much?

While QE doesn’t show on the balance sheet as debt (that’s why my original post referred to as “off the books’) it most certainly impacts the economy in complex ways. Both good and bad. But where’s do you draw the line. When is enough enough.

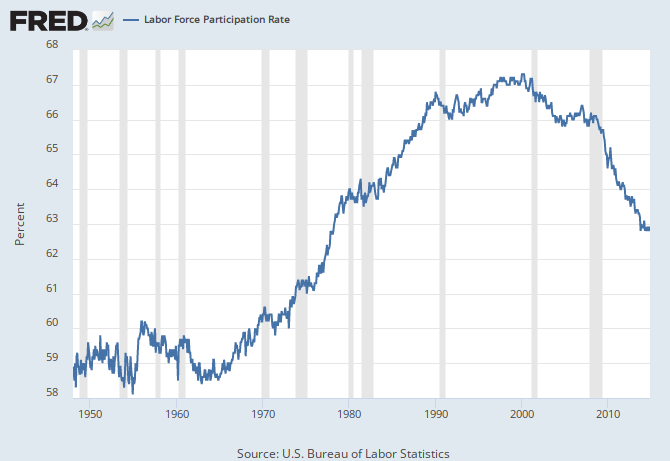
Assets flowing from QE onto the Fed's balance sheet are now the equivalent of one-fifth of US GDP. Meaning, the FED is pumping money into the economy by buying bonds and treasuries to falsely prop it up, artificially stimulate it, and buy down inflation. This makes Obama look good. Provides a false sense of positive outlook. The average uninformed voter (aka “Stupid Voters”) have no idea what is going on in the background.

At some point the negative downside to QE will start to creep in as the Fed tries to ween the fake ‘propped up’ economy off of the endless supply of money that the Fed has been, in effect, electronically printing.

The longer a QE cycle runs… the steeper the withdrawal symptoms when it stops.

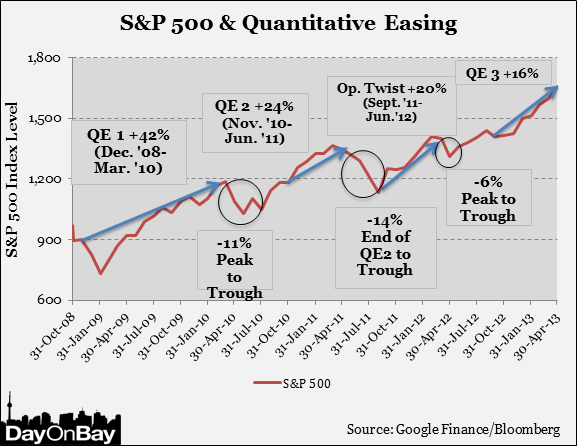
Example: One clearly visible side effect of QE is Market Growth, not built on fundamentals. When the original QE ended, the market withdrew and it stymied growth in the entire economy. So QE2 was implemented. When it expired the same thing happened. So they came up with QE3 only this time they did not set limits on it. It continued unabatedly pumping 85 billion dollars into the economy every month, until just recently. Now the roll back starts. Let the fun begin!

Chart-By-DayOnBay.png

"Now the roll back starts. Let the fun begin!"

Yeah, I'm wondering what's going to happen when the other shoe drops.
 
You have to realize that "confidence" generated by statistics, real or imagined, are what supports the "faith" in fiat currency and the words "full faith and trust." Do you or I think the gov't, via the BLS, would massage statistical data to maintain an illusion of "confidence?" Does a cat have an ass?
 
The lfpr has little to do with anything. ... The lfpr is what it is, and it's a flawed metric that is based on the expectation that my 99 year old grandmother should be working, and that all 16 year old high school kids should be working. This country existed for 202 years with a lower labor force participation rate than what we have now. It's a non-issue.

the unemployment rate is what it is. The way it is computed today is identical to the way it was computed under Bush, Clinton, Bush, Reagan, etc.


Once again... Wrong On Both Counts...

--------------------------

Understanding Workforce Participation & Unemployment

Source: Poof! The Government’s 9 Million Jobless Vanishing Act

When we look at broad measures of jobs and population, then the beginning of 2012 was one of the worst months in US history, with a total of 2.3 million people losing jobs or leaving the workforce in a single month. Yet, the official unemployment rate showed a decline from 8.5% to 8.3% in January - and was such cheering news that it set off a stock rally.

How can there be such a stark contrast between the cheerful surface and an underlying reality that is getting worse?

The true unemployment picture is hidden by essentially splitting jobless Americans up and putting them inside one of three different "boxes": the official unemployment box, the full unemployment box, and the most obscure box, the workforce participation rate box.

9-million-missing-workers.jpg


As we will explore herein, a detailed look at the government's own data base shows that about 9 million people without jobs have been removed from the labor force simply by the government defining them as not being in the labor force anymore. Indeed - effectively all of the decreases in unemployment rate percentages since 2009 have come not from new jobs, but through reducing the workforce participation rate so that millions of jobless people are removed from the labor force by definition.


See the full report--> HERE

God, that idiocy has been around for a while. Let's go to their basic claim:
The secret to our miracle is that we have two "hard" numbers and one "soft" number. The "hard" numbers are the total working age population and the number of actual jobs. The "soft" number is the definition of what percentage of the working age population wants a job. And a government which desires to control public perceptions can, by manipulating that obscure definition, make the reported unemployment rate "sit, roll over or bark like a dog" at will, almost regardless of what is actually happening with jobs.

In other words, he's claiming that the government only collects data on the population and jobs, then arbitrarily decides what the Labor Force participation rate will be, and uses that to come up with an unemployment rate.

The problem is that that bears no resemblance to reality. In reality, the population is estimated by the Census Bureau, and then, every month, they interview 60,000 households and ask if the person works, looked for work work, if they want a job etc.
If the person worked, s/he is classified as employed, if s/he didn't work, is available to work, looked for work in last 4 weeks, s/he is unemployed. The number of employed and unemployed are added together to find the Labor Force, and the Labor Force is divided by the population to get the participation rate and the number of unemployed is divided by the Labor Force to get the unemployment rate.

So no, the government doesn't change the Labor Force participation rate… it's a dependent variable.
 
Let's go to their basic claim:
... he's claiming that the government only collects data on the population and jobs, then arbitrarily decides what the Labor Force participation rate will be, and uses that to come up with an unemployment rate.

The author of this article does NOT make any such claim. It appears that you are trying to obfuscate the premise through distraction.

The problem is that that bears no resemblance to reality.

In reality, the population is estimated by the Census Bureau, and then, every month, they interview 60,000 households and ask if the person works, looked for work work, if they want a job etc. If the person worked, s/he is classified as employed, if s/he didn't work, is available to work, looked for work in last 4 weeks, s/he is unemployed. The number of employed and unemployed are added together to find the Labor Force, and the Labor Force is divided by the population to get the participation rate and the number of unemployed is divided by the Labor Force to get the unemployment rate.

Wrong! Your summation is incomplete and thus invalid. So much so that it could be considered intentional misinformation strategically presented to to discredit the author of the article.

IN REALITY, please refer to the indisputable facts found at: US Department of Labor> Bureau of Labor Statistics> Labor Force Statistics from the Current Population Survey> How the Government Measures Unemployment [http://www.bls.gov/cps/cps_htgm.htm]

In short this document validates author DANIEL AMERMAN CFA and all the information provided in his article dated 13 March 2012.

A quick review of this official document will show that you have conveniently disregarded an important sector of the population.

Who is not in the labor force? [http://www.bls.gov/cps/cps_htgm.htm]

As mentioned previously, the labor force is made up of the employed and the unemployed. The remainder—those who have no job and are not looking for one—are counted as not in the labor force. Since the mid-1990s, typically fewer than 1 in 10 people not in the labor force reported that they want a job.

A series of questions is asked each month of persons not in the labor force to obtain information about their desire for work, the reasons why they had not looked for work in the last 4 weeks, their prior job search, and their availability for work. These questions include the following (the bolded words are emphasized when read by the interviewers).

1 Do you currently want a job, either full or part time?
2 What is the main reason you were not looking for work during the last 4 weeks?
3 Did you look for work at any time during the last 12 months?
4 Last week, could you have started a job if one had been offered?
These questions form the basis for estimating the number of people who are not in the labor force but who are considered to be marginally attached to the labor force. These are individuals without jobs who are not currently looking for work (and therefore are not counted as unemployed), but who nevertheless have demonstrated some degree of labor force attachment.

Specifically, to be counted as marginally attached to the labor force, they must indicate that they currently want a job, have looked for work in the last 12 months (or since they last worked if they worked within the last 12 months), and are available for work.

Discouraged workers are a subset of the marginally attached. Discouraged workers report they are not currently looking for work for one of the following types of reasons:

• They believe no job is available to them in their line of work or area.
• They had previously been unable to find work.
• They lack the necessary schooling, training, skills, or experience.
• Employers think they are too young or too old, or
• They face some other type of discrimination.​
By adding and then modifying the new Discouraged Workers category, the Administration has used these loose rules to dump millions of truly unemployed off of the roles to improve their visuals.

By using this questionable technique, the Administration is able to claim improvements in the unemployment rate when, IN REALITY, they have just removed large numbers of individuals from the unemployment roles by definition only.

So no, the government doesn't change the Labor Force participation rate… it's a dependent variable.


If, IF, IF your statement is valid, then how do you explain the Sept. 2012 Change In Participation Rate anomaly that coincides with the abnormally large decrease in the U3 Unemployment Rate ? How do you explain the recent increase and spikes in CWP that has a long history of remaining almost static?
 
You have to realize that "confidence" generated by statistics, real or imagined, are what supports the "faith" in fiat currency and the words "full faith and trust." Do you or I think the gov't, via the BLS, would massage statistical data to maintain an illusion of "confidence?" Does a cat have an ass?

It is amazing how ignorant/naive the masses (and people on this site) can be.

Many people do not trust their politicians, but they just automatically trust the bureaucrats that allow these corrupt governments to function.

Like these bureaucrats are above it all, like they never receive or give into pressure from the politicians to come up with ways to alter the statistics so as to a) make the government look better and b) cover the bureaucrats legal asses while they do it.

If you are going to (rightly) question the ethics of politicians then you are a staggering ignoramus to not also question the ethics of the bureaucrats who carry out the wishes of the politicians.

They are all in it together.
 
At this rate we'll be at negative unemployment by the time Obama leaves. We could actually have enough openings to lower the unemployment rate of other countries. :lol:
 
Like these bureaucrats are above it all, like they never receive or give into pressure from the politicians to come up with ways to alter the statistics so as to a) make the government look better and b) cover the bureaucrats legal asses while they do it..

While that can happen in some agencies...those that are mostly policy and put out some statistics, I have never seen nor heard of it happening with any dedicated statistical agency such as Census, BEA, BLS, NASS, etc. There is no incentive. Anecdotaly I heard that Newt Gingrich did try to get Katerherine Abraham to massage the numbers when she was BLS Commissioner and she refused. I know Reagan tried to get a BLS analyst fired when his response to a press inquiry contradicted Reagan's remarks, but any real pressure? No.

How do you think it could work? It's almost impossible to do as there are too many people and too much oversight to succeed. No one in the administration gets the data for principle federal economic indicators until the night before release. There's no way to change anything.
 
It is amazing how ignorant/naive the masses (and people on this site) can be.

Many people do not trust their politicians, but they just automatically trust the bureaucrats that allow these corrupt governments to function.

Like these bureaucrats are above it all, like they never receive or give into pressure from the politicians to come up with ways to alter the statistics so as to a) make the government look better and b) cover the bureaucrats legal asses while they do it.

If you are going to (rightly) question the ethics of politicians then you are a staggering ignoramus to not also question the ethics of the bureaucrats who carry out the wishes of the politicians.

They are all in it together.
There was, of course, the allegation by that NY Post writer last year that at least 2 Census workers in the Philadelphia region were pressured to fake interviews. But that's not politicians, and there were no claims that any specified result was desired. And the IG report found no evidence of anyone being asked to fake reports. And they noted that the reports that were faked had no effect on the Labor Force data. The guy caught faking reports was fired.

So....what process are you claiming is used to manipulate the reports and what is your evidence that this occurs?
 
The author of this article does NOT make any such claim. It appears that you are trying to obfuscate the premise through distraction.
Oh? How do you interpret his claim that the only "hard numbers" are jobs and the population and that manipulating the participation rate changes the number of unemployed?

Wrong! Your summation is incomplete and thus invalid.
It was summarized, but nothing was inaccurate. Which you know, or you would have pointed it out.

So much so that it could be considered intentional misinformation strategically presented to to discredit the author of the article.
And yet you don't point out any misinformation.

IN REALITY, please refer to the indisputable facts found at: US Department of Labor> Bureau of Labor Statistics> Labor Force Statistics from the Current Population Survey> How the Government Measures Unemployment [http://www.bls.gov/cps/cps_htgm.htm]

In short this document validates author DANIEL AMERMAN CFA and all the information provided in his article dated 13 March 2012.
How? His claim was that BLS could change the participation rate and "vanish" numbers of the unemployed. There's nothing in the BLS brief that validates this.

A quick review of this official document will show that you have conveniently disregarded an important sector of the population.
Because they're not part of the calcualtions for the unemployment rate, and therefore not relevant for the specific comments I was making.

Who is not in the labor force? [http://www.bls.gov/cps/cps_htgm.htm]

As mentioned previously, the labor force is made up of the employed and the unemployed. The remainder—those who have no job and are not looking for one—are counted as not in the labor force. Since the mid-1990s, typically fewer than 1 in 10 people not in the labor force reported that they want a job.

A series of questions is asked each month of persons not in the labor force to obtain information about their desire for work, the reasons why they had not looked for work in the last 4 weeks, their prior job search, and their availability for work. These questions include the following (the bolded words are emphasized when read by the interviewers).
These questions form the basis for estimating the number of people who are not in the labor force but who are considered to be marginally attached to the labor force. These are individuals without jobs who are not currently looking for work (and therefore are not counted as unemployed), but who nevertheless have demonstrated some degree of labor force attachment.

Specifically, to be counted as marginally attached to the labor force, they must indicate that they currently want a job, have looked for work in the last 12 months (or since they last worked if they worked within the last 12 months), and are available for work.

Discouraged workers are a subset of the marginally attached. Discouraged workers report they are not currently looking for work for one of the following types of reasons:
How do you think that contradicts what I said? The people respond to the questions and are categorized by set definitions as Employed, Unemployed, (together the Labor Force) and Not in the Labor force. The UE rate is Unemployed/labor force and the labor force participation rate is Labor force / population. The BLS analyst can't arbitrarily assign categories..its' all based on what the people say.
By adding and then modifying the new Discouraged Workers category, the Administration has used these loose rules to dump millions of truly unemployed off of the roles to improve their visuals.
How? If someone says they were looking for work, BLS can't just decide to classify him as discouraged. You'll have to walk me through the steps you think happen, because right now, you're not making any sense.
Ths sample is surveyed. Responses are collected. Individuals are classified by category based on response. Everything is aggregated. Where do you see any "technique" to add or modify anything?

If, IF, IF your statement is valid, then how do you explain the Sept. 2012 Change In Participation Rate anomaly that coincides with the abnormally large decrease in the U3 Unemployment Rate ? How do you explain the recent increase and spikes in CWP that has a long history of remaining almost static?
How is this a long history of remaining almost static?
fredgraph.png
 
...
How is this a long history of remaining almost static?
fredgraph.png

First, if you put the baseline percentage at zero, the graph wouldn't look as nearly dramatic. And from the peak to todays rate, that's only about a 4% difference, we saw a much larger difference between the time I was born and the time that I graduated high school. The LFPR when my son turned 21 was about the same as it was when I turned 21.

Secondly, the reason that it increased about 8% was mostly due to women entering the workforce, which means that they were no longer productive at home. We tend to assume that only people who are employed outside of the home are productive, but of course that's not true. What's the difference between someone staying at home and growing and preparing food, and making their own cloths, vs producing those items outside the home and then using the money that they made to purchase them? Either way, we are still productive.

If we wanted to measure productivity of our country, a much better measurement would be GDP/citizen.
 
First, if you put the baseline percentage at zero, the graph wouldn't look as nearly dramatic. And from the peak to todays rate, that's only about a 4% difference, we saw a much larger difference between the time I was born and the time that I graduated high school. The LFPR when my son turned 21 was about the same as it was when I turned 21.
Unfortunatley, I don't think I can do that on FRED. But the main point was that the change in Sept 2012 was not some huge abnormal variation.

Secondly, the reason that it increased about 8% was mostly due to women entering the workforce, which means that they were no longer productive at home.
Correct.
We tend to assume that only people who are employed outside of the home are productive, but of course that's not true. What's the difference between someone staying at home and growing and preparing food, and making their own cloths, vs producing those items outside the home and then using the money that they made to purchase them? Either way, we are still productive.
It's not a question of productivity...the Labor Force stats are meant to measure the Labor Market. Doing housework is not competing in the labor market.

If we wanted to measure productivity of our country, a much better measurement would be GDP/citizen.[/QUOTE]
 
...
It's not a question of productivity...the Labor Force stats are meant to measure the Labor Market. Doing housework is not competing in the labor market....

I agree that the stats are what they are, and that they should be used appropriately. Trying to measure our productivity, or how robust our economy is, or our standard of living by using the LFPR isn't an appropriate use. The only thing that the LFPR tells is is what percentage of people 16 years old or older and who aren't institutionalized, are working or seeking work. It's not entirely a bad thing if an individual chooses to be a full time student, or to retire, or to be a homemaker. If those people have the ability to exist without an income from work, then more power to them.

Until the Obama administration, few people have ever even heard of or thought about the lfpr. But Obama bashers are using it as a way to "prove" that our economy isn't doing well, and of course in reality, Obama and the strength of our economy has less to do with the lfpr than demographics and sociology does.

"Homemaking" does compete with the labor market indirectly. If I stay home and prepare my meals, then I am competing with paid food preparation.
 
Payroll employment increases by 321,000 in November; unemployment rate unchanged

this is terrible somehow, i bet.

:lol:
 
this is terrible somehow, i bet.

:lol:

Terrible for people who are looking to bash our economy.

And terrible for people who would have preferred that this 321,000 remain on unemployment and welfare.
 
Terrible for people who are looking to bash our economy.

And terrible for people who would have preferred that this 321,000 remain on unemployment and welfare.

i always enjoy watching posters play "debunk the jobs report." it's the same thing every month. i'm wondering how a Republican congress will change the interpretation on both sides. i'm guessing that some posters will have a tough time deciding whether to laud the numbers or debunk them.
 
I agree that the stats are what they are, and that they should be used appropriately. Trying to measure our productivity, or how robust our economy is, or our standard of living by using the LFPR isn't an appropriate use. The only thing that the LFPR tells is is what percentage of people 16 years old or older and who aren't institutionalized, are working or seeking work. It's not entirely a bad thing if an individual chooses to be a full time student, or to retire, or to be a homemaker. If those people have the ability to exist without an income from work, then more power to them.

Until the Obama administration, few people have ever even heard of or thought about the lfpr. But Obama bashers are using it as a way to "prove" that our economy isn't doing well, and of course in reality, Obama and the strength of our economy has less to do with the lfpr than demographics and sociology does.

"Homemaking" does compete with the labor market indirectly. If I stay home and prepare my meals, then I am competing with paid food preparation.

I agree.
 
this is terrible somehow, i bet.

:lol:

No, it's a great number, potentially

But when the household survey says that only 4,000 more Americans are employed - that raises serious doubts about the numbers' legitimacy.

And when the household survey also says that 150,000 fewer Americans are working full time AND (the NOT seasonally adjusted household survey) says there were actually 270,000 FEWER Americans employed in November compared to October.

Plus a whopping (again NOT seasonally adjusted) 735,000(!) FEWER Americans were employed full time in November compared to October.

How anyone can rationally take all that in and still say this was a great or even a good report, is beyond me.


And btw, I am neither rep nor dem, neither con nor lib...so (unlike most on here it seems) I have no agenda and I have an open mind in this. My bias is to the truth.
 
Last edited:
No, it's a great number, potentially

But when the household survey says that only 4,000 more Americans are employed - that raises serious doubts about the numbers' legitimacy.

And when the household survey also says that 150,000 fewer Americans are working full time AND (for the NOT seasonally adjusted household survey) there were actually 270,000 FEWER Americans employed in November compared to October.

Plus a whopping (again NOT seasonally adjusted) 735,000(!) less Americans employed in November compared to October.

How you can take all that in and still say this was a great or even a good report, is beyond me.


And btw, I am neither rep nor dem, neither con nor lib...so (unlike most on here it seems) I have no agenda and I have an open mind in this. My bias is to the truth.

like i said, i'm sure that 321,000 jobs is terrible somehow. just out of curiosity, how long have you been debunking job reports? i think i've noticed you in the monthly threads before, but i wanted to know a little more about your personal debunking history.
 
Back
Top Bottom