• This is a political forum that is non-biased/non-partisan and treats every person's position on topics equally. This debate forum is not aligned to any political party. In today's politics, many ideas are split between and even within all the political parties. Often we find ourselves agreeing on one platform but some topics break our mold. We are here to discuss them in a civil political debate. If this is your first visit to our political forums, be sure to check out the RULES. Registering for debate politics is necessary before posting. Register today to participate - it's free!

Scary 1929 Market Chart gains traction

Ehh...the Dow in 1927 (to show a 2 year rally) went from around 150 to 381. Over double the value.
The current rally for the past 2 years goes 13,000 ish to a high of 16,577.

2 years isn't a big deal for inflation (comparing 2012-14 or 1927-29) but using an inflation adjusted DOW for other years we're not very far from the high's in 96 or even the 2006 peak.

Adjusted for inflation the 1929 Dow Jones wasn't hit again after the Great Depression until the late 1960's to just give you some perspective on how inflated that market was. Even the majority of the 50's was spent with a market only half as high as the 1929 pre crash market.


But this isn't actually arguing causation, only correlation. So, for instance, if the correlation were to continue the end result would be the DOW losing all of its gains of the last 2 years and falling to 13,500 this year. That wouldn't be happy times.
 
You didn't read one ****ing thing I posted did you...

Probably one too many.

And a declining unemployment rate with the highest percentage of working individuals NOT in the workforce equals BAD ****ING NEWS.

A declining participation rate isn't positive news. That does not equal a recession or a depression anywhere outside of Mr Nick madhatterville.

You do realize unemployment statistics are nothing more than those currently working divided by those currently receiving unemployment benefits?

Wrong. As pointed out to you by multiple posters. You simply have zero clue what you're talking about as usual.

- of course that doesn't speak for the 90 million that don't receive unemployment and or gave up looking for employment... That number is astronomical - our true unemployment rate is at like 30%.

Yeah. If you count all the retirees, students and full time parents as unemployed the number would be pretty high alright. Kids too. ****ing moochers all!

Learn something before you ever address me in another post EVER.
:lamo:lamo:lamo:lamo:lamo
 
You don't think magnitude matters? Come on man, this is just silly.

Slowdown or weakness is always a risk, but a crash? If you understand the fundamentals of economics, there's no reason for a crash right now.

I never said it didn't matter. If the correlation held true we would be expecting a rapid 2300 point correction this year. That isn't good times.
 
I never said it didn't matter. If the correlation held true we would be expecting a rapid 2300 point correction this year. That isn't good times.

There is no correlation without a correlating magnitude. Comparing the two charts is apples and potatoes, it makes zero sense and means nothing.
 
Probably one too many.


A declining participation rate isn't positive news. That does not equal a recession or a depression anywhere outside of Mr Nick madhatterville.


Wrong. As pointed out to you by multiple posters. You simply have zero clue what you're talking about as usual.


Yeah. If you count all the retirees, students and full time parents as unemployed the number would be pretty high alright. Kids too. ****ing moochers all!

:lamo:lamo:lamo:lamo:lamo

Yes a declining unemployment rate is good news to those who get their news via progressive media outlets, while the unskilled, overskilled, purged and laid off rise to 90 million workers currently NOT in the work force or are taking some remedial job getting paid cash under the table is NOT good sign of economic growth, what those numbers are saying is that 1/3rd of us work full time tax paying jobs and the other 2/3rds don't and now have to rely on government somehow-someway, of course that is the easy way out and how democrats get paid for their votes. If you want that government gravy rolling you better vote for a "D" but for a price they will make sure you're their Pinocchio.....
 
That chart is proof positive that the Matrix has been reset and the destruction of Zion is imminent. :peace

If you look at the chart as a single piece of evidence...
If you add the tax rates for the same period, there is also an interesting parallel. In contrast, you can also look at the taxes rates during the acknowledged most prosperous time in the US (1950-1970) and compare those to the rates of the 1920s and since 1980.
 
But this isn't actually arguing causation, only correlation. So, for instance, if the correlation were to continue the end result would be the DOW losing all of its gains of the last 2 years and falling to 13,500 this year. That wouldn't be happy times.

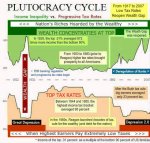
When top economists and wealthy investors alike start singing the same tune, I tend to pay attention to them! The charts are eerie confirmation of what they've been saying lately, and are an alarming look at what is apparently increasingly possible, IMO. :eek:

Greetings, jmotivator. :2wave:
 
And a declining unemployment rate with the highest percentage of working individuals NOT in the workforce equals BAD ****ING NEWS.n
If they were working they'd be in the Labor Force. And we certainly do not have the highest percentage of the population not in the Labor Force.

You do realize unemployment statistics are nothing more than those currently working divided by those currently receiving unemployment benefits?
Apparently you don't realize that's nonsense: the UE rate is unemployed, defined as wants a job, available for work, and actively looking for work, as a percent of the Labor Force (unemployed plus employed). Benefits have never had anything to do with calculating the rate.

of course that doesn't speak for the 90 million that don't receive unemployment and or gave up looking for employment...
Over 90% of those 90 million don't want a job. They're retired, disabled, students, stay ho e spouses, etc.

That number is astronomical - our true unemployment rate is at like 30%.
Either show your math or admit you just made that up.

Learn something before you ever address me in another post EVER.
Everything you wrote was false and yet you're telling someone else to learn the topic? You have balls.
 
There is no correlation without a correlating magnitude. Comparing the two charts is apples and potatoes, it makes zero sense and means nothing.

False.
 
The argument tends to revolve around the x axis fit. The problem with that argument is that an x axis fit is only really needed if you are trying to show causation. Straight correlations like this don't need the same x axis.

I dont think there is any argument with the chart...it shows a matching trend from two time periods that are closely mimicking one another. He never made any statements of warning that this was going to happen...I dont see what the nay sayers are arguing about, thats all.
 
Yeah, I posted this as a tag on to a thread yesterday....So far I have been called every name in the liberal book, while libs dismiss the chart.

I certainly won't dismiss the chart... in fact, what is scary is this chart about income disparity and the stock market crash.....

Wealth Disparity - Weath Gap.jpg


PS- your can ignore the implied correlation between wealth gap/stock market crash and highest marginal tax rate, most Cons do...
 
I read all these pages with liberal posters blaming cons and vice versa, when will everyone accept that this problem is worldwide caused by both sides of the political spectrum? All we are doing now is passing the blame and prolonging the inevitable.
 
Interesting thing is you can post all the data you want, talk about market manipulation via counterfeit ing by the fed, and the left will run around screaming that there is nothing to see here, all the while propping up global warming.
 
I read all these pages with liberal posters blaming cons and vice versa, when will everyone accept that this problem is worldwide caused by both sides of the political spectrum? All we are doing now is passing the blame and prolonging the inevitable.

I used to think that. Once you educate yourself and understand how everything works, it paints a very different picture. There is reality and then there is the alternate reality that is used as a weapon.
 
I used to think that. Once you educate yourself and understand how everything works, it paints a very different picture. There is reality and then there is the alternate reality that is used as a weapon.

That's a huge crock. Both sides of the political spectrum in the USA are two sides of the same coin. Nether represent the interests of the constituency. If they did Bush and now Obama would not have some of the worst poll numbers in history. The people have been screwed by half baked laws and bought career politicians from sea to shining sea.
 
I used to think that. Once you educate yourself and understand how everything works, it paints a very different picture. There is reality and then there is the alternate reality that is used as a weapon.

Course their is.....:roll:
 
Obviously "past performance is not indicative of future performance" rules apply here, but it is certainly a bit chilling!

Scary 1929 market chart gains traction - Mark Hulbert - MarketWatch

The talk is all about a chart that takes the last 19 months of DJIA results and compares them to the 19 months leading up to the great depression:

View attachment 67161953

It's a frighteningly tight fit!

So, anyway.. :scared:

Yeah, I posted this as a tag on to a thread yesterday....So far I have been called every name in the liberal book, while libs dismiss the chart.

Take a look at the scales on the chart

The 1929 one nearly doubles in the time frame from 200 to about 380

The 2012 goes from 12400 to 16400, a much smaller increase of around 30%

The chart creator was counting on idiots to look at the lines and ignore the scale for each line. It looks like he found an audience

I've already said that I understand that...And further, I have said that even if you take the numbers out of it, the trend itself is astonishing, and although the market is much larger today than in 1930, it still would not be a good thing to see that sort of drop now would it?

You whole argument is that we won't suffer as much because the market is so much bigger, but I say that even a drop like that today would still hurt, and many would suffer...But I understand real people don't matter when dismissing bad news these days.

:roll| appeal to emotions.

Look, this is not evidence that a major downturn is coming. The magnitude is wildly different, and the couple years before 1928 don't match the last few years.
 
I highly doubt that there is an impending market crash such as was back in 1929. The fundamentals then and now aren't really even close to being the same.

Yes, there is a correction due, as one could legitimately argue that the market is overvalued.
Yes, there will be an impact when the fed withdraws or tapers down the QE crack that the market is on right now.

But a crash? Like 1929? No, don't think so. Highly unlikely.
 
Obviously "past performance is not indicative of future performance" rules apply here, but it is certainly a bit chilling!

Scary 1929 market chart gains traction - Mark Hulbert - MarketWatch

The talk is all about a chart that takes the last 19 months of DJIA results and compares them to the 19 months leading up to the great depression:

View attachment 67161953

It's a frighteningly tight fit!

So, anyway.. :scared:
The gains at that time were based upon unbacked margin used to purchase stocks which resulted in widespread panic and a large correction that lasted till WWII. The current "boom" is based upon inflated dollars being pumped into the market which is basically just government issued "margin" in the form of "stimulus". If they keep on this track a reset will take a long time to correct values and will be painful. In both cases, the market was inflated by dollars that just weren't there.
 
I read all these pages with liberal posters blaming cons and vice versa, when will everyone accept that this problem is worldwide caused by both sides of the political spectrum? All we are doing now is passing the blame and prolonging the inevitable.
Absolutely. The left and right both realized a long time ago that economic data doesn't have to be good, it just has to appear to be good for election cycles, they also know that pumping inflated currency into a market appears on the surface to be good because the numbers skew upwards, it's fine to have market gains as long as the value in the market is close to the numbers shown, but when a lot of people enter into a market based upon inflated values whether that is because of margin purchases or endless streams of printed dollars there is much less actual value in the market than is presented which leads to correction, in the case of economics correction is a good and bad thing, it's good because it will force the value back to it's actual proximity but bad in that a lot of people will be hurt.
 
I highly doubt that there is an impending market crash such as was back in 1929. The fundamentals then and now aren't really even close to being the same.

Yes, there is a correction due, as one could legitimately argue that the market is overvalued.
Yes, there will be an impact when the fed withdraws or tapers down the QE crack that the market is on right now.

But a crash? Like 1929? No, don't think so. Highly unlikely.
A crash is plausible, hopefully we would have people smart enough to slowly stop the bad cash injections to force a gradual correction but the closer we get to elections the less likely that scenario becomes. I would rather we back off of the constant QE programs and get back to actual value before it comes to a crash scenario. The big issue with printing is at some point the presses will stop, whether that is because the value of currency is so inflated that it can no longer sustain viability in the market, OR because inflation is so bad that people are taking a wheelbarrow full of money to buy a loaf of bread and demand that the presses stop(but at that point it's nearly impossible to bring the value back).
 
Back
Top Bottom