
- Joined
- Dec 9, 2009
- Messages
- 134,496
- Reaction score
- 14,621
- Location
- Houston, TX
- Gender
- Male
- Political Leaning
- Conservative
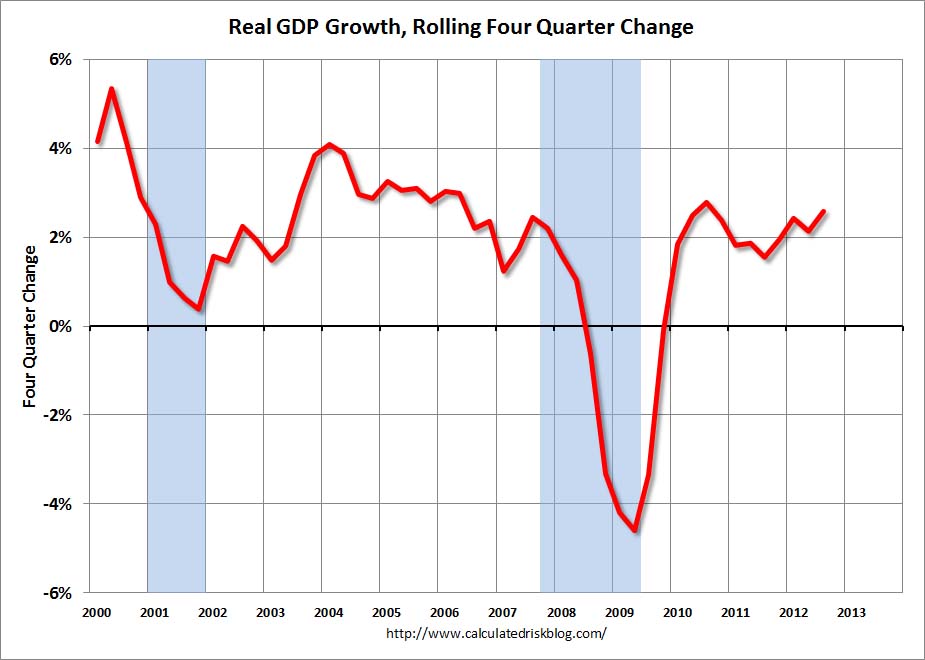
It shows the economy rapidly recovering up until 2004 and then diving to the depths of unheard of levels thereafter. That's three years of accelerating growth and 4 years of deceleration, followed by a year of extreme contraction. Obama, OTOH, has shown accelerated improvement after six months in office and nothing but growth after a year in office. In other words, my graph shows Conservative's assertion in post 408 to be full of ****.
Let's see how good your math is. I can beat you to death all day with actual numbers
Feel free to calculate the GDP by year and get back to me. From BLS.govTable 1.1.5. Gross Domestic Product
[Billions of dollars]
Bureau of Economic Analysis
Last Revised on: November 07, 2013 - Next Release Date December 05, 2013
Line * 2000 2001 2002 2003 2004 2005 2006 2007 2008
1 Gross domestic product 10289.7 10625.3 10980.2 11512.2 12277 13095.4 13857.9 14480.3 14720.3
2001-32o billion
2002-350 billion
2003-360 billion
2004-530 billion
2005-760 billion
2006-870 billion
2007-630 billion
2008-240 billion
Your support for Obama is part of the 40% and shows how intellectually challenged you are
") and of all things ..I seems you have rummaged through johnny carson's old boxes of goods and found this old karnak hat.
and of all things ..I seems you have rummaged through johnny carson's old boxes of goods and found this old karnak hat.