- Joined
- Oct 11, 2011
- Messages
- 2,018
- Reaction score
- 918
- Gender
- Undisclosed
- Political Leaning
- Undisclosed
Re: Romney's tax rate is only half as high as the middle class pays
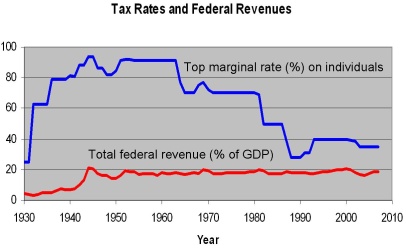
Preliminary findings do no suggest much of a correlation between top tax rates and income taxes as a percentage of federal receipts. As you can see below, beginning in 1944 and progressing to current tax year data the individual income tax has netted between 40-50% of total federal receipts.
Year - Ind. Income Tax portion of total receipts - Top tax rate
1935 14.6% 63.0%
1936 17.2% 79.0%
1937 20.3% 79.0%
1938 19.0% 79.0%
1939 16.3% 79.0%
1940 13.6% 81.1%
1941 15.1% 81.0%
1942 22.3% 88.0%
1943 27.1% 88.0%
1944 45.0% 94.0%
1945 40.7% 94.0%
1946 41.0% 86.5%
1947 46.6% 86.5%
1948 46.5% 82.1%
1949 39.5% 82.1%
1950 39.9% 91.0%
1951 41.9% 91.0%
1952 42.2% 92.0%
1953 42.8% 92.0%
1954 42.4% 91.0%
1955 43.9% 91.0%
1956 43.2% 91.0%
1957 44.5% 91.0%
1958 43.6% 91.0%
1959 46.3% 91.0%
1960 44.0% 91.0%
1961 43.8% 91.0%
1962 45.7% 91.0%
1963 44.7% 91.0%
1964 43.2% 77.0%
1965 41.8% 70.0%
1966 42.4% 70.0%
1967 41.3% 70.0%
1968 44.9% 75.3%
1969 46.7% 77.0%
1970 46.9% 71.8%
1971 46.1% 70.0%
1972 45.7% 70.0%
1973 44.7% 70.0%
1974 45.2% 70.0%
1975 43.9% 70.0%
1976 44.2% 70.0%
1977 44.3% 70.0%
1978 45.3% 70.0%
1979 47.0% 70.0%
1980 47.2% 70.0%
1981 47.7% 69.1%
1982 48.2% 50.0%
1983 48.1% 50.0%
1984 44.8% 50.0%
1985 45.6% 50.0%
1986 45.4% 50.0%
1987 46.0% 38.5%
1988 44.1% 28.0%
1989 45.0% 28.0%
1990 45.2% 31.0%
1991 44.3% 31.0%
1992 43.6% 31.0%
1993 44.2% 39.6%
1994 43.1% 39.6%
1995 43.7% 39.6%
1996 45.2% 39.6%
1997 46.7% 39.6%
1998 48.1% 39.6%
1999 48.1% 39.6%
2000 49.6% 39.6%
2001 49.9% 38.6%
2002 46.3% 38.6%
2003 44.5% 35.0%
2004 43.0% 35.0%
2005 43.1% 35.0%
2006 43.4% 35.0%
2007 45.3% 35.0%
2008 45.4% 35.0%
2009 43.5% 35.0%
2010 41.5% 35.0%