• This is a political forum that is non-biased/non-partisan and treats every person's position on topics equally. This debate forum is not aligned to any political party. In today's politics, many ideas are split between and even within all the political parties. Often we find ourselves agreeing on one platform but some topics break our mold. We are here to discuss them in a civil political debate. If this is your first visit to our political forums, be sure to check out the RULES. Registering for debate politics is necessary before posting. Register today to participate - it's free!

Obama's Recovery In Just 9 Charts[W:64]

Re: Obama's Recovery In Just 9 Charts

Oh? If a 17 year old babysits for 2 hours is she employed? If a day laborer doesn't get any work for a week, is he employed? In October 2013, thousands of federal employees on furlough mistakenly answered that they were employed but absent from work when they were in fact unemployed.

Life is full of grey areas...that is why the definitions are so precise, and they differe for the different measures. Some who are classified as employed in the household survey used for the unemployment rate would not be employed in the official jobs numbers and some who are employed in the jobs numbers are not employed in the household survey.

Look, love your posts but not your knit picking. I stand by my post and the context in which it was given per the thread topic. Anyone who thinks that the unemployment rate truly indicates the state of the economy today is out of touch with reality. your defense of BLS is noted but the reality is anytime anyone points to BLS data and ties it to the state of the economy the comments are suspect at best. The low information voter (Obama supporters) is going to buy the low unemployment rate as an indication of success by Obama and that couldn't be further from the truth.
 
Re: Obama's Recovery In Just 9 Charts

Look, love your posts but not your knit picking. I stand by my post and the context in which it was given per the thread topic.

My point is that nit-picking is actually important. With loose definitions and vague phrasing you can make the economy look however you want it to. If someone doesn't understand exactly what the numbers mean, they won't make sense of it.

Anyone who thinks that the unemployment rate truly indicates the state of the economy today is out of touch with reality.
I agree.


your defense of BLS is noted but the reality is anytime anyone points to BLS data and ties it to the state of the economy the comments are suspect at best.
It depends. As you have said, the numbers have to be taken in the proper context, whch includes knowing exactly what they cover and don't


The low information voter (Obama supporters) is going to buy the low unemployment rate as an indication of success by Obama and that couldn't be further from the truth.
But it is an indication of success. But other factors mitigate how strong that success is.
 
Re: Obama's Recovery In Just 9 Charts

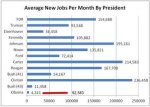
notice the difference between Reagan and Obama?

Yes, and I notice two other things. In that analysis, Obummer is held responsible for the loss of 4.1 million jobs in 2009. That doesn't make sense economically. Those losses were the result of the GOP SSE Great Recession. Secondly, it uses data that's more than three years old. 6.5 million jobs have been added in the thirty-eight months since Oct 2012, an average of 172K per month.

Looking at the president's entire record so far, he's currently at 92.6K added per month. Over the past six years, the average is 198.6. If that trend continues, he'll finish at 105.8. To compare Reagan and Obama, you'd need to account for both the larger labor force today (makes Obummer look worse) and the oft-mentioned demographic trends (makes him look better).

jobs_added_per_month_by_pres.jpg

>>liberals always talk about the severity of the 07-09 recession but ignore the 81-83 recession.

We don't talk about an 81-83 recession because no such thing occurred. There was a very brief recession during the first six months of 1980. Reagan was running for office. A full year later, in Jul 1981, after he came in and got his fiscal and monetary policies implemented, there was a second, much longer and much deeper recession that lasted sixteen months.
 
Re: Obama's Recovery In Just 9 Charts

Yes, and I notice two other things. In that analysis, Obummer is held responsible for the loss of 4.1 million jobs in 2009. That doesn't make sense economically. Those losses were the result of the GOP SSE Great Recession. Secondly, it uses data that's more than three years old. 6.5 million jobs have been added in the thirty-eight months since Oct 2012, an average of 172K per month.

Looking at the president's entire record so far, he's currently at 92.6K added per month. Over the past six years, the average is 198.6. If that trend continues, he'll finish at 105.8. To compare Reagan and Obama, you'd need to account for both the larger labor force today (makes Obummer look worse) and the oft-mentioned demographic trends (makes him look better).

View attachment 67195363

>>liberals always talk about the severity of the 07-09 recession but ignore the 81-83 recession.

We don't talk about an 81-83 recession because no such thing occurred. There was a very brief recession during the first six months of 1980. Reagan was running for office. A full year later, in Jul 1981, after he came in and got his fiscal and monetary policies implemented, there was a second, much longer and much deeper recession that lasted sixteen months.

Nice distortion, diversion, and downright lie, Reagan's economic policy was passed in August 1981, Volker raised interest rates from 1979 and then again in June 1981. Your very selective and partisan rhetoric is noted

Inflation, which peaked at 14.8 percent in March 1980, fell below 3 percent by 1983. The Federal Reserve board led by Volcker raised the federal funds rate, which had averaged 11.2% in 1979, to a peak of 20% starting in 1976.
In December 1980 The prime rate was 18% starting at 6+ in 1976 so blaming Reagan on this issue is nothing but partisan BS

https://www.newyorkfed.org/markets/statistics/dlyrates/fedrate.html

As for the job losses. what happened to that stimulus program that was signed early February 2009 for shovel ready jobs. that is why Obama is responsible and that number is understated by a rise in the Discouraged workers to 1.3 million which aren't counted. Keep buying the leftwing spin and ignoring the Obama STIMULUS
 
Re: Obama's Recovery In Just 9 Charts

Do you understand the difference between a deficit and DEBT? What good is reducing the deficits that remain at record highs and adding 8.2 trillion to the debt? Love your chart now put it into context? How many Presidents had trillion dollar deficits so don't you think deficits over a trillion dollars should be reduced more rapidly?

Debt to the Penny (Daily History Search Application)

Lol debt is the integral of deficits.

Do you seriously not know there's a relationship between deficits and debt ...?
 
Re: Obama's Recovery In Just 9 Charts

Lol debt is the integral of deficits.

Do you seriously not know there's a relationship between deficits and debt ...?

So reducing the deficits that remain at record highs is a good thing for you even though it created the 8.2 trillion dollar Obama debt? Wow, so as long as the deficit is reduced and even though it remains at record highs that is a good thing? that is liberal logic.
 
Re: Obama's Recovery In Just 9 Charts

So reducing the deficits that remain at record highs is a good thing for you even though it created the 8.2 trillion dollar Obama debt? Wow, so as long as the deficit is reduced and even though it remains at record highs that is a good thing? that is liberal logic.

That's not even a little bit close to what i said.
 
Re: Obama's Recovery In Just 9 Charts

I am paraphrasing what you say based upon all your posts

No, if you were, you'd know that i don't really care about debts or deficits. Inflation is not a problem, so debts are not an issue.

I just counter the conservative bull**** that democrats are the only problem with regards to debts and deficits.
 
Re: Obama's Recovery In Just 9 Charts

No, if you were, you'd know that i don't really care about debts or deficits. Inflation is not a problem, so debts are not an issue.

I just counter the conservative bull**** that democrats are the only problem with regards to debts and deficits.

Yet you bring up the Reagan debt all the time ignoring what the Reagan debt and the Obama debt generated. You counter nothing including your own lack of understanding of basic economics and leadership. The deficits that add to the debt and generate the kind of results that Obama has generated is a disaster for the U.S. and the future economy.
 
Re: Obama's Recovery In Just 9 Charts

Yet you bring up the Reagan debt all the time ignoring what the Reagan debt and the Obama debt generated. You counter nothing including your own lack of understanding of basic economics and leadership. The deficits that add to the debt and generate the kind of results that Obama has generated is a disaster for the U.S. and the future economy.

No, the concentration of wealth is the disaster for our economy. President Obama is more conservative than President Reagan, which is far more conservative than what we need.
 
Re: Obama's Recovery In Just 9 Charts

Nice distortion, diversion, and downright lie

Just plain gibberish. What did I distort, where did I divert, and how did I lie?

>>Reagan's economic policy was passed in August 1981

As always, you ignore the way the economy anticipates actions when it serves yer ideological purposes.

>>Volker raised interest rates from 1979 and then again in June 1981.

Wrong. Yer always wrong, but that doesn't even slow you down. You just keep posting the same fabrications over and over.

Rates were indeed raised starting in Aug 1979. They went down sharply in the summer of 1980. The recession was OVER. Volker pushed them back up through the roof in the fall, hitting 21.5% by mid-Dec. They then fell throughout 1981, except for a bump back up in Apr and May, leading into the Reagan Recession starting in July.

>>Your very selective and partisan rhetoric is noted

Yer consistent errors in reporting economic data are well-established.

>>In December 1980 The prime rate was 18% starting at 6+ in 1976 so blaming Reagan on this issue is nothing but partisan BS

Reagan encouraged the Fed's tight rate policy in Apr-May 1981.

Effective Federal Funds Rate

>>what happened to that stimulus program that was signed early February 2009 for shovel ready jobs.

It led to the creation of 14.65 million jobs over the six years since Dec 2009, as measured by the more-accurate establishment survey.

Seasonally adjusted, total nonfarm employment

Dec 2009 — 128588

Dec 2015 — 143242

>>Obama is responsible

In part, yes.

>>that number is understated by a rise in the Discouraged workers to 1.3 million which aren't counted.

Discouraged workers are unrelated to the employment figure. You have absolutely no clue what yer talking about.

>>Keep buying the leftwing spin and ignoring the Obama STIMULUS

You can't change the figures.
 
Re: Obama's Recovery In Just 9 Charts

No, the concentration of wealth is the disaster for our economy. President Obama is more conservative than President Reagan, which is far more conservative than what we need.

Look, you display a jealousy that is going to lead to failure if you don't get it under control. you keep talking about the concentration of wealth at the top but never once have you told us how any rich person prevented you from joining them? You obviously have no clue as to what being a conservative means if you think Obama is more conservative than Reagan. Your posts show exactly who you are.
 
Re: Obama's Recovery In Just 9 Charts

Just plain gibberish. What did I distort, where did I divert, and how did I lie?

>>Reagan's economic policy was passed in August 1981

As always, you ignore the way the economy anticipates actions when it serves yer ideological purposes.

>>Volker raised interest rates from 1979 and then again in June 1981.

Wrong. Yer always wrong, but that doesn't even slow you down. You just keep posting the same fabrications over and over.

Rates were indeed raised starting in Aug 1979. They went down sharply in the summer of 1980. The recession was OVER. Volker pushed them back up through the roof in the fall, hitting 21.5% by mid-Dec. They then fell throughout 1981, except for a bump back up in Apr and May, leading into the Reagan Recession starting in July.

>>Your very selective and partisan rhetoric is noted

Yer consistent errors in reporting economic data are well-established.

>>In December 1980 The prime rate was 18% starting at 6+ in 1976 so blaming Reagan on this issue is nothing but partisan BS

Reagan encouraged the Fed's tight rate policy in Apr-May 1981.

Effective Federal Funds Rate

>>what happened to that stimulus program that was signed early February 2009 for shovel ready jobs.

It led to the creation of 14.65 million jobs over the six years since Dec 2009, as measured by the more-accurate establishment survey.

Seasonally adjusted, total nonfarm employment

Dec 2009 — 128588

Dec 2015 — 143242

>>Obama is responsible

In part, yes.

>>that number is understated by a rise in the Discouraged workers to 1.3 million which aren't counted.

Discouraged workers are unrelated to the employment figure. You have absolutely no clue what yer talking about.

>>Keep buying the leftwing spin and ignoring the Obama STIMULUS

You can't change the figures.

I posted the link to federal fund rate increases and you ignored it which is why I am ignoring the rest of the bs you post and ignoring you
 
Re: Obama's Recovery In Just 9 Charts

I posted the link to federal fund rate increases and you ignored it

No, I didn't. How does the information in that document contradict anything I said? I posted a document with information that's easier to access. Yer well-known for posting links that aren't useful, like the front page of an agency.

>>which is why I am ignoring the rest of the bs you post and ignoring you

Ignore away. All that means is that I win the debate by default. The true reason you don't respond is that you have nothing useful to say.

14.65 million jobs added in the past six years. Ya see how yer ignoring stuff really has no consequence?
 
Re: Obama's Recovery In Just 9 Charts

Look, you display a jealousy that is going to lead to failure if you don't get it under control. you keep talking about the concentration of wealth at the top but never once have you told us how any rich person prevented you from joining them? You obviously have no clue as to what being a conservative means if you think Obama is more conservative than Reagan. Your posts show exactly who you are.

None of this addresses any point relevant to my statement.
 
Back
Top Bottom