as for the issue of what lower tax rates mean for revenues:
Analyzing the data presented on this chart, we make the following observations:
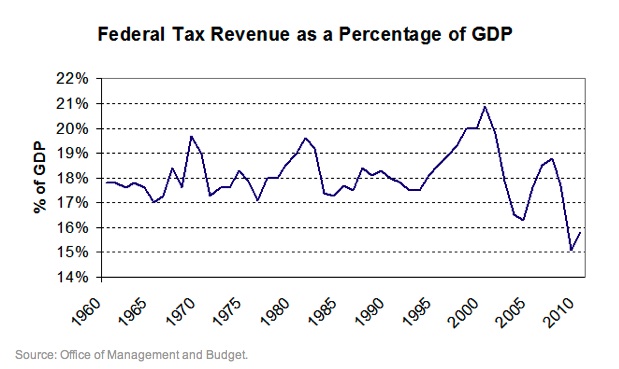
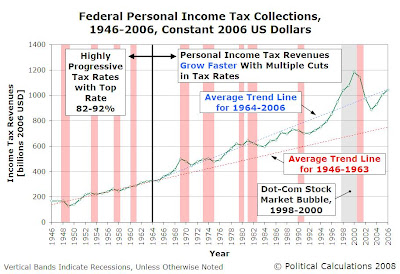
1. The average percentage of GDP represented by U.S. federal personal income tax revenues from 1946 through 2006 is 8.0%. The percentage share of personal income tax revenues with respect to GDP is normally distributed, with a standard deviation of 0.8%. This defines the typical range for the personal income tax share of GDP of 7.2% to 8.8%...
2. Recessions (shown by the vertical red bands) often coincide with decreased revenue for the federal government from personal income taxes. This is exactly what we should expect to see, as the total level of income earned falls with employment levels during recessions...
3. There are unique circumstances that coincide with percentage shares greater than 8.8%:..
4. Unique circumstances also apply to the one period in which the percentage share of personal income taxes dipped below the lower level of 7.2%...
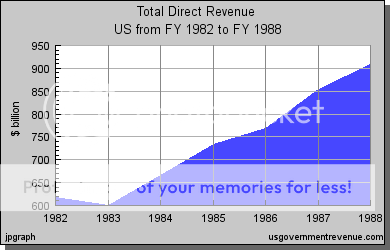
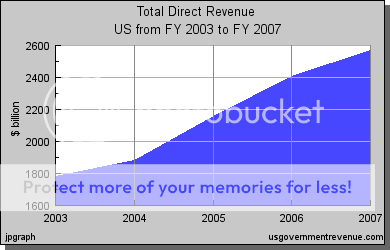
5. Years in which tax rate cuts took effect (1964, 1970, 1971, 1982, 1987, 1988, 1991 and 2003) all saw government collections of personal income taxes dip initially, then begin to rise afterward, with the total of personal income tax collections always falling in the range between 7.2% and 8.8% of GDP...
This last phenomenon suggests that the distribution of taxable income shifts in accordance with changes in the tax rate structure of the income tax code to maintain a stable equilibrium with respect to overall GDP, albeit with a small lagging effect. This level of equilibrium is given by a level of personal income tax collections representing 8.0% of GDP, plus or minus 0.8%, which holds in the absence of unique economic and fiscal policy factors.
Basically, this means that as tax rates change, people shift their level of economic production to account for the change in the tax rate structure, and do so in a way that maintains this overall level of equilibrium.
In the case of a steeply progressive tax rate structure, people act to reduce their economic output (and income) or channel it in ways so as to avoid the increased level of taxation through personal income taxes. In the case of a flatter tax rate structure, people act to increase their economic output and income, dispense with tax avoidance strategies, and personal income tax collections rise in the years following when the tax rate reduction is first implemented to levels consistent with the natural level of equilibrium.
Where the economy is concerned, higher, more progressive tax rates would result in both lower levels of GDP and personal income tax collections, while lower, flatter tax rates would result in higher levels of GDP and personal income tax collections...


")