Let's run an example. Joe (age 23) and Cindy (age 22) get married after meeting at college. Joe and Cindy both make $18,000 a year, and get the annual raises that Social Security assumes for it's forecasting tools (a rate of 2.5% a year). Joe and Cindy are young with no kids, and so they agree to save 15% for retirement. They are cooking with gas and doing well.
They are? They're earning $36k a year, which is much less than the median income. 2.5% raise per year barely breaks even with inflation.
So let's hypothesize...
Taxes = 17% or $6k (this includes EITC, mortgage credit, local taxes etc)
Housing = 30% or $11k (or $916/mo)
2 old cars = 17% or $6k
Food = 17% or $6k
Health insurance = 4% or $1450
Internet, 2 phones, clothing, presents = 9% or $3120
Remainder = 6% or $2160
Again, this is hardly a spendthrift family. This doesn't include any vacations, or cable TV, or fancy dining, or college tuition, or yachts or drones or any of that stuff.
Right off the bat, saving 15% sounds somewhat unrealistic. At best, it's an outlier for anyone in that income quintile.
Even with the 6% savings figure, under absolutely ideal circumstances -- starting at zero, earning 10% return, putting away all of it, never dipping into it except to buy a house -- they will end up with roughly $1.6 million after 45 years... or $540k in 2015 dollars, with 2.5% inflation.
That's not bad, and with the standard 4% draw they are above the poverty line (barely). Except it means they never take a vacation, never get sick, never get laid off, don't pay for any college expenses, and the kids never ask for money.
In the real world, people at that income level cannot save 6% of their income. It's not because they are all spendthrifts or irresponsible or lack all self-control. It's because
life in America is expensive.
Let's compare this to a couple that earns $100k, which almost puts them into the 4th quintile. We'll have them spend a little more.
Taxes = 20% or $20k (this includes EITC, mortgage credit, local taxes etc)
Housing = 30% or $30k (or $2500/mo)
2 Ford Fiestas = 13% or $13k
Food = 8% or $8k
Health insurance = 2.5% or $2500
Internet, 2 phones, clothing, presents = 4.5% or $4500
Remainder = 22% or $22k
By tripling their income, even with higher expensive, the remainder has increased
tenfold. A family with this level of income has a lot more latitude. As is typical for people in the top 20%, they are significantly more likely to have savings (and own a home) at retirement.
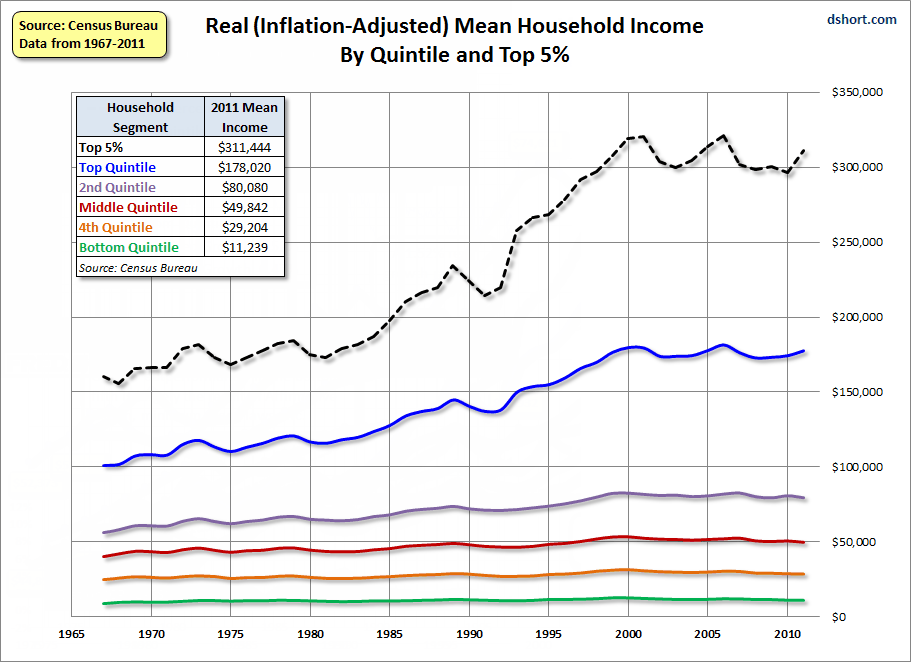
As to the "blame the Boomers" thing, that's another mistake. Most of them have paid their taxes (payroll and otherwise) for decades, with most of the tax cuts benefitting the super-wealthy. The vast majority of them are at the tender mercies of global capitalism; specifically, wages for almost all employees have stagnated or eroded since the 1970s. A variety of factors have eroded the fiscal health of Boomers and their retirement, including but not limited to:
• Women entering the workforce, faster than men leaving it, since the 1970s (more workers = downward pressure on wages)
• Erosion of manufacturing employment in the US, due to both automation and international labor competition (as manufacturing used to provide decent middle-class wages without higher education)
• The deterioration of unions, who used to protect many middle-class jobs
• CEOs and top-ranking executives taking almost all of the wage increases
• The rising costs of, and greater need for, higher education
• Numerous recessions, including the worst economic downturn since the 1930s
• Stagflation and high inflation for much of the 1970s
• Elimination of pensions in favor of 401(k)s, which pay less and are less secure
• Higher job turnover / less job security than in the past
In other words: During the time that you claim Boomers had a "great chance" to build wealth, those opportunities were largely lost to a variety of externalities.
There is no question that
some people are financially irresponsible, or make poor decisions. E.g. there is no doubt that millions of Americans bought homes they could not afford, or took out second mortgages and used them unwisely, while the housing bubble was still building.
At the same time, it doesn't make sense to ignore every single structural change in the economy that has impacted the economy over the past 50 years, and declare that the
only reason people are short on retirement savings is due to personality flaws.

")