• This is a political forum that is non-biased/non-partisan and treats every person's position on topics equally. This debate forum is not aligned to any political party. In today's politics, many ideas are split between and even within all the political parties. Often we find ourselves agreeing on one platform but some topics break our mold. We are here to discuss them in a civil political debate. If this is your first visit to our political forums, be sure to check out the RULES. Registering for debate politics is necessary before posting. Register today to participate - it's free!

Lewandowsky and Mann on Stifling Debate

Right.

You know that the expectation is that warming will accelerate, right?

Or haven't you gotten to read the IPCC past the first chapter in 2003?

That's been the expecation all along since this AGW cult started.

If it does not do so, at what point will you consider the idea a dead duck?? 20 years? 50 years? Never?
 
So your using some random 2014 article that focuses precisely on the year you tell us NOT to look at- a 1998 El Niño- to make your point?

Laughable.
Laugh all you want, you are still wrong.
Pick your own years, demonstrate a decade long acceleration in the warming,
greater than that between 1978 and 1998.
Use the GISS so it's the same data.
 
Laugh all you want, you are still wrong.
Pick your own years, demonstrate a decade long acceleration in the warming,
greater than that between 1978 and 1998.
Use the GISS so it's the same data.

So I need to pick years to compare with your cherry picked years?

LOL.
 
So I need to pick years to compare with your cherry picked years?

LOL.
No, You need to show that the global warming is accelerating.
What was that you said back in post #43, oh yea,
You know that the expectation is that warming will accelerate, right?
So show some acceleration!
 
Let's get back to Michael Mann and the accuracy of his prediction.
He said in a Scientific American article that we will cross the 2 C threshold by 2036.
Earth Will Cross the Climate Danger Threshold by 2036 - Scientific American
That would require warming per decade warming of .565 C, for two decades in a row.
How likely is that, when we look at the data.
Within the GISS data set, the fastest per decade rate was .42 C in 1943
The next fastest was .41C in 1981.
Since 2000 only 2003 at .38 C is anywhere near the fastest decades, and that includes
much of the massive warming in the 90's.
The highest 20 year rate was a .57 C in 2005, but that is still only half of rate
required to meet Mann's prediction.
 
Just did. Guess you cant click on underlined text?
You can paraphrase what the skeptical Science blog says, but it is funny that you think a blog
represents data.
 
You can paraphrase what the skeptical Science blog says, but it is funny that you think a blog
represents data.

Odd, IF you take the effort to click on the link, you'll see it consists of data and data interpretation. N

I guess I could cut and paste it and put it here ala JH. Would that suddenly make it 'data' when it shows up on this website, vs the other one?

Whats funny is that you think a DP post represents data, versus a written article vetted by actual scientists on a different website.
 
You are the one that says the warming will accelerate.
Back it up with the data!

I suppose if you want the full set of data, you can look here


IPCC - Intergovernmental Panel on Climate Change

It clearly shows that the warming will be accelerating with continued emissions, and justifies those projections with hundreds of pages of explanation and references.

I figured you knew this, but I guess I assumed too much!
The IPCC predicts with models that they expect the warming to accelerate.
I am asking you to some some of that acceleration within the existing data.
http://data.giss.nasa.gov/gistemp/tabledata_v3/GLB.Ts+dSST.txt
In addition, I am stating that since you cannot show said acceleration,
and the fastest increase that has been observed in the last 135 years is less
than half of the rate necessary to satisfy Mann's prediction,
His prediction is not plausible.
 
I suppose if you want the full set of data, you can look here


IPCC - Intergovernmental Panel on Climate Change

It clearly shows that the warming will be accelerating with continued emissions, and justifies those projections with hundreds of pages of explanation and references.

I figured you knew this, but I guess I assumed too much!

Hell's teeth.....

Yes it says that the temperature will rise and this rise will accelerate. But it hasn't and isn't. That's the point. That's why the prediction is wrong.
 
The IPCC predicts with models that they expect the warming to accelerate.
I am asking you to some some of that acceleration within the existing data.
http://data.giss.nasa.gov/gistemp/tabledata_v3/GLB.Ts+dSST.txt
In addition, I am stating that since you cannot show said acceleration,
and the fastest increase that has been observed in the last 135 years is less
than half of the rate necessary to satisfy Mann's prediction,
His prediction is not plausible.

I guess I will need to cut and paste.

New Research Confirms Global Warming Has Accelerated

Posted on 25 March 2013 by dana1981
A new study of ocean warming has just been published in Geophysical Research Letters by Balmaseda, Trenberth, and Källén (2013). There are several important conclusions which can be drawn from this paper.

Completely contrary to the popular contrarian myth, global warming has accelerated, with more overall global warming in the past 15 years than the prior 15 years. This is because about 90% of overall global warming goes into heating the oceans, and the oceans have been warming dramatically.
As suspected, much of the 'missing heat' Kevin Trenberth previously talked about has been found in the deep oceans. Consistent with the results of Nuccitelli et al. (2012), this study finds that 30% of the ocean warming over the past decade has occurred in the deeper oceans below 700 meters, which they note is unprecedented over at least the past half century.
Some recent studies have concluded based on the slowed global surface warming over the past decade that the sensitivity of the climate to the increased greenhouse effect is somewhat lower than the IPCC best estimate. Those studies are fundamentally flawed because they do not account for the warming of the deep oceans.
The slowed surface air warming over the past decade has lulled many people into a false and unwarranted sense of security.

The Data
In this paper, the authors used ocean heat content data from the European Centre for Medium-Range Weather Forecasts' Ocean Reanalysis System 4 (ORAS4). A ‘reanalysis’ is a climate or weather model simulation of the past that incorporates data from historical observations. In the case of ORAS4, this includes ocean temperature measurements from bathythermographs and the Argo buoys, and other types of data like sea level and surface temperatures. The ORAS4 data span from 1958 to the present, and have a high 1°x1° horizontal resolution, as well as 42 vertical layers. As the authors describe the data set,

"ORAS4 has been produced by combining, every 10 days, the output of an ocean model forced by atmospheric reanalysis fluxes and quality controlled ocean observations."

Accelerated Global Warming
As illustrated in Figure 1 above, the study divides ocean warming into three layers for comparison – the uppermost 300 meters (grey), 700 meters (blue), and the full ocean depth (violet). After each of the Mt. Agung, Chichón, and Pinatubo volcanic eruptions (which cause short-term cooling by blocking sunlight), a distinct ocean cooling event is observed in the data. Additionally, after the very strong El Niño event of 1998, a cooling of the upper 300 and 700 meters of oceans is visible as a result of heat being transfered from the surface ocean to the atmosphere.

One of the clearest features in Figure 1 is the rapid warming of the oceans over the past decade. As we have previously discussed, the warming of the shallower oceans has slowed since around 2003, which certain climate contrarians have cherrypicked to try and argue that global warming has slowed. However, more heat accumulated in the deeper oceans below 700 meters during this period. The authors describe the ocean warming since 1999 as,

"the most sustained warming trend in this record of OHC. Indeed, recent warming rates of the waters below 700m appear to be unprecedented."

Their results in this respect are very similar the main conclusion of Nuccitelli et al. (2012), in which we noted that recently, warming of the oceans below 700 meters accounts for about 30% of overall ocean and global warming. Likewise, this new study concludes,

"In the last decade, about 30% of the warming has occurred below 700 m, contributing significantly to an acceleration of the warming trend."

The warming of the oceans below 700 meters has also been identified by Levitus et al. (2012) and Von Schuckmann & Le Traon (2011), for example.
 
I suppose if you want the full set of data, you can look here


IPCC - Intergovernmental Panel on Climate Change

It clearly shows that the warming will be accelerating with continued emissions, and justifies those projections with hundreds of pages of explanation and references.

I figured you knew this, but I guess I assumed too much!

LOL...

Once again, linking the main site, instead of a specific paragraph. That does nobody any good. Is that how you get your jollies?

How lazy are you?
 
Wailing and gnashing of teeth.
I am guessing you would rather not try and show an acceleration of the warming with the actual data.
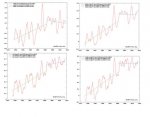
I have gathered a few graphs from wood for trees, showing the different slopes before and after 2001.
I purposefully bypassed 1998 as it was a El Nino year, but also excluded 2015, for the same reason.
WFT_ocean_temp.jpg
Wood for Trees: Interactive Graphs
Ocean temp slight decline, UAH, slight decline, Hadcrut4 looks almost flat,
and GISS shows warming since 2001, but at a much lower slope than the 1978 to 2001 period.
So once again, where do you see an acceleration of the warming?
 
I have gathered a few graphs from wood for trees, showing the different slopes before and after 2001.
I purposefully bypassed 1998 as it was a El Nino year, but also excluded 2015, for the same reason.

You didn't bypass anything. You included the 1997/98 El Nino data in the early trends and eliminated the 2015/16 El Nino in the later trends therefore completely biasing the comparisons you are making in favor of the denialist position.

You are doing exactly what you claim should not be done! And as far as I have seen you and your fellow denialists have been doing this repeatedly for years.
 
Back
Top Bottom