• This is a political forum that is non-biased/non-partisan and treats every person's position on topics equally. This debate forum is not aligned to any political party. In today's politics, many ideas are split between and even within all the political parties. Often we find ourselves agreeing on one platform but some topics break our mold. We are here to discuss them in a civil political debate. If this is your first visit to our political forums, be sure to check out the RULES. Registering for debate politics is necessary before posting. Register today to participate - it's free!

Holocene Poses Difficulty for AGW Concept

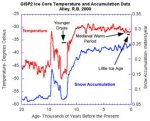
Have you shown that the uptick at the end of the OP graph is "just shy of 1 degree C" as you claimed? No, it's still more like 0.3 C.

You can claim whatever you think it is. It looks closer to 1 degree than half a degree.

Have you acknowledged or otherwise explained your error in confusing Greenland temperatures with global temperatures? Nope, haven't done that either.

I'm talking about Greenland temperatures in the 20th century that you believe are not displayed. What was the Greenland temperature anomaly in 1900? And what was it by 2000? The trend doesn't appear to be anywhere near the +2C difference you claim. It looks like at or less than 1C to me.

Have you proven wrong my claim that Greenland's temperatures are more than 1C higher than in 1950-80? On the contrary, you have proven me correct; in fact it's more like 2 degrees.

No, it isn't. By the graph provided 1950 was around +1 anomaly and 1980 was at or below zero. How that equals greater than +1 trend you will need to explain.

Have you demonstrated that the graph in the OP actually does show the "present warming" for that location? Precisely the opposite again; the graph obviously doesn't show anything at the end on the scale of the short 2-3 degree upswings and longer cooling trends seen above.

You are arguing a few decades out of 15,000+ years. The graph appears to end at AD 2000, it may run to 2016 but in a 15,000 year span I can't eyeball 16 years.

Have you demonstrated that the OP graph shows the "present global warming," as it claims to?

That's been my complaint all along:

But your complain is silly, and your claims about warming trends in Greenland are both cherry picked and irrelevant.
 
I didn't say the ice core data goes to 2000, I said the graph does. I'm sure they just used "Mike's Nature Trick"....
Ball's graph was deliberately MISLABELED. If the dataset ended in 1885, it should have said 1855. It's NOT the 'present'. Sheesh. How do you not comprehend this? You also apparently don't have a clue what "Mike's Nature Trick" was either.

Nope. Unless you want to accuse Mann, Jones, Briffa and the rest of the Alarmist high clergy of deliberate deception.
Nope. There was no deception. You've allowed yourself to be fooled into believing there was by people who post deliberately deceptive rubbish on climate truther/anti-science blogs, conservative political think tank websites, trash media etc and not scientists who publish research in peer-reviewed Science Journals. I suppose it's not surprising you were so easily fooled given how you've just shown your inability to fact check a source or read a graph, detect a faked graph, or comprehend the difference between global temperatures and local temperatures.
 
Last edited:
The Holocene temperature record poses some problems for proponents of the AGW concept. They haven't really dealt with them well.


A Warm Period by Any Other Name – The Climatic Optimum

Hypsithermal, Altithermal, Holocene Optimum, Holocene Thermal Maximum, Holocene Megathermal, Anthropogene; Guest opinion: Dr. Tim Ball There is frustration and reward when an article appears on the same topic of an article you are completing – in this case the Holocene. Such was the case this week with Andy May’s article “A Review of temperature reconstructions.”…

Continue reading →

". . . Even a cursory examination of the Holocene shows why the period is problematic for promoters of anthropogenic global warming (AGW). As Steve McIntyre pointed out, the problems began when skeptics noted that the temperature for most of the Holocene contradicted their claim that the latter part of the 20th century was the warmest ever. I know they never used the term ‘ever’, rather, it was left unsaid but implied in the message to the public and not contradicted when used by the media.
McIntyre wrote;
The Team has taken a preditable (sic) position on the Holocene Optimum: that it’s a regional and restricted event.
It was predictable because it was the same argument they used for the Medieval Warm Period (MWP). Prove an event was regional, and you essentially eliminate the Sun as a mechanism of change – an issue central to the AGW CO2 argument. The restriction included the claim that only summer temperatures were warmer. Even if true, it is not possible to say based on proxy records with 40 to 70-year smoothing averages applied. Interestingly, the IPCC clung to this “Team” view as recently as AR4 (2007).
The temperature evolution over the Holocene has been established for many different regions, often with centennial-resolution proxy records more sensitive to specific seasons.
Of course, this was before Climategate and the leaked emails that destroyed the Team’s credibility. . . ."


That is actually an excellent article. I have not looked at the quality of the statistics yet and will. But it is certainly well argued.
 
Well sure, that's because climate scientists are referring to global average temperature changes, not local temperature changes. If you ever saw a graph showing a global average temperature change of 20C over 15,000 years it would be a ridiculous fake.

And where did anyone ever claim that?

The current global average temperature is about 15C, so if you saw a graph with 20C changein global average temperature it would be over hundreds of millions of years, not 15,000.

You are missing the point entirely. I am discussing the SCALE of the Iceland graph which is 20C to incorporate the enormous warming since the minimum during the last ice age and also the minimum at the end of the Younger Dryas. In such a scale a single degree or so will look small.

The difference in global average temperature between now and the Last Glacial Maximum when ice sheets covered most of the Northern America, northern Europe and Asia, is only about 5C and took many thousands of years. The global average temperature has increased almost 1C since 1850. That's quite a lot, and it's fast.

No, you are trying to compare disparate temporal scales. Longer, less precise time scales don't capture the maximum peaks and maximum valleys the same way that direct observation does. If we take the most precise ice core data we have data points 50 years apart. If you were to break up the last 100 years into two 50 year average data points your 1C warming trend would be decidedly muted.
 
Now, can you muster up some smidgeon of integrity to acknowledge that since there's fewer than ten million hunger-related deaths per year total, your constant claim for over two and a half years that "tens of millions" of people per year die from biofuel food price increases (with associated slander of other posters), which you've been regularly called out on, is and always has been clearly and obviously false?

You have told me repeatedly that I don't care about the future of humanity because I don't follow the AGW cult of panic.

I consider the AGW cult of panic to have produced the biofuel situation.

I think that 10 million people per year is a very conservative estimate of the munbers dying as a result of a 70% increase in basic food prices. You disagree. OK.

I do not think it is is wrong of me to attempt to persuade the world that we should stop using food as fuel.

You want me to shut up about it and not shout about it. I will continue to shout about it.
 
You can claim whatever you think it is. It looks closer to 1 degree than half a degree.


I'm talking about Greenland temperatures in the 20th century that you believe are not displayed. What was the Greenland temperature anomaly in 1900? And what was it by 2000? The trend doesn't appear to be anywhere near the +2C difference you claim. It looks like at or less than 1C to me.


No, it isn't. By the graph provided 1950 was around +1 anomaly and 1980 was at or below zero. How that equals greater than +1 trend you will need to explain.


You are arguing a few decades out of 15,000+ years. The graph appears to end at AD 2000, it may run to 2016 but in a 15,000 year span I can't eyeball 16 years.


But your complain is silly, and your claims about warming trends in Greenland are both cherry picked and irrelevant.
Hopeless. Really. How about you just you go right on believing that the 'present' is 1855 and the temperature at the top of the Greenland ice-sheet in 1855 represents in the current average temperature of the whole earth and that everything you read on a climate truther/anti-science conspiracy blogs is The Truth.
 
And where did anyone ever claim that?


You are missing the point entirely. I am discussing the SCALE of the Iceland graph which is 20C to incorporate the enormous warming since the minimum during the last ice age and also the minimum at the end of the Younger Dryas. In such a scale a single degree or so will look small.


No, you are trying to compare disparate temporal scales. Longer, less precise time scales don't capture the maximum peaks and maximum valleys the same way that direct observation does. If we take the most precise ice core data we have data points 50 years apart. If you were to break up the last 100 years into two 50 year average data points your 1C warming trend would be decidedly muted.
No, it's you who is not just missing the whole point but you are missing the whole PLANET. (and now you've changed countries to Iceland instead of Greenland too). GLOBAL AVERAGE temperatures are not the same as the temperature at ONE LOCATION. There is a far greater range of temperatures in one location. 1C change in one location doesn't mean too much. 1C change in the GLOBAL AVERAGE temperature is quite large. The GLOBAL AVERAGE temperature does not change over a 20C range over thousands of year.
Please note the words in CAPITALS as you seem to be having a lot of difficulty understanding them.
 
Hopeless. Really. How about you just you go right on believing that the 'present' is 1855 and the temperature at the top of the Greenland ice-sheet in 1855 represents in the current average temperature of the whole earth and that everything you read on a climate truther/anti-science conspiracy blogs is The Truth.

You have a bad habit of attacking arguments that nobody made. As I said before, the graph likely has observational data spliced to the end of it.
 
No, it's you who is not just missing the whole point but you are missing the whole PLANET. (and now you've changed countries to Iceland instead of Greenland too). GLOBAL AVERAGE temperatures are not the same as the temperature at ONE LOCATION.

And I never claimed they were. I stated that the warming in the 20th century was around 1C in Iceland based on the graph I provided, and that warming would appear small when transposed onto a graph with a 20C scale.

There is a far greater range of temperatures in one location. 1C change in one location doesn't mean too much. 1C change in the GLOBAL AVERAGE temperature is quite large. The GLOBAL AVERAGE temperature does not change over a 20C range over thousands of year.
Please note the words in CAPITALS as you seem to be having a lot of difficulty understanding them.

Again, nice straw man, Quaestio. You have marked with capitals your counter arguments to things nobody has argued.
 
You have a bad habit of attacking arguments that nobody made. As I said before, the graph likely has observational data spliced to the end of it.
You've demonstrated in this thread that you have an atrocious habit of not being able to read a graph or do a source check, or fact check or comprehend the difference between one location and the entire globe, and a willingness to unsceptically believe what you want to believe rather than accept the facts. There is NO additional 'observational data' spliced on the end of the graph. The data is ONLY the GISP2 dataset from Alley 2000 and Cuffey and Clow 1997. The dataset ends in 1855. The graph has been MISLABELED and skewed. For pity's sake, use your brain and go do some fact-checking and educate yourself before making even more embarrassing comments.
 
Last edited:
Must you defend every single wattsup spam? Do you get a notification when an OP of wattsup is posted? Every single thread, you suck wattsup as hard as he does. You're the wattsup bros. Blogspam ftw, ay? Is this your idea of "alternative education"?

It's interesting that you attack other posters instead of stating, specifically, what statements in the article linked to you disagree with.
 
And I never claimed they were. I stated that the warming in the 20th century was around 1C in Iceland based on the graph I provided, and that warming would appear small when transposed onto a graph with a 20C scale.


Again, nice straw man, Quaestio. You have marked with capitals your counter arguments to things nobody has argued.
Do you even know what thread you are posting on?
 
You've demonstrated in this thread that you have an atrocious habit of not being able to read a graph or do a source check, or fact check or comprehend the difference between one location and the entire globe, and a willingness to unsceptically believe what you want to believe rather than accept the facts. There is NO additional 'observational data' spliced on the end of the graph. The data is ONLY the GISP2 dataset from Alley 2000 and Cuffey and Clow 1997. The dataset ends in 1855. The graph has been MISLABELED and skewed. For pity's sake, use your brain and go do some fact-checking and educate yourself before making even more embarrassing comments.

So look at the Alley 2000 paper on the NOAA site right here. In that you will find Alley's 2000 reconstruction as shown below:

alley2000.jpg

Hmmmm... that looks... familiar....

Note Alley's markings of the LIA which ended in 1850, and the distinct uptick after the LIA... what does that data come from in Alley 2000?
 
Last edited:
Do you even know what thread you are posting on?

You can keep trolling if you want to, it won't save your misguided argument.
 
That is actually an excellent article. I have not looked at the quality of the statistics yet and will. But it is certainly well argued.
So you don't even know the whole blog article is based on a deliberately mislabeled dishonest graph from one location at the top of the Greenland icesheet with a dataset that ended in 1855? And that Ball is using that to make egregiously false claims about GLOBAL average temperatures in the last 120 years?

But you believe it's an 'excellent article' and 'well argued'? :D

I look forward to reading your in-depth expert views about the 'quality of the statistics'. ;)
 
Last edited:
So you don't even know the whole article is based on a deliberately mislabeled dishonest graph from one location at the top of the Greenland icesheet with a dataset that ended in 1855? And that Ball is using that to make false claims about GLOBAL average temperatures in the last 120 years?

But you believe it's an 'excellent article' and 'well argued' :D

Looks like another typical WUWT climate truther disciple.

That might be true. It is certainly a good idea to look at the robustness of the data, when an article is based on such. On the other hand, the article demonstrates something I had noticed a long time ago about the long data samples. They do not seem to support the heating climate hypothesis, when you look back further in prehistory. The first thing one notes is that there were considerably warmer periods than today's. The second is that although there is a relatively high correlation between CO2 and temperature, CO2 does not appear to be the leading indicator in the numbers.

But maybe you can shine some light on the data you so dislike.
 
It's interesting that you attack other posters instead of stating, specifically, what statements in the article linked to you disagree with.
Oh please, enough with the victim card. Is that really your only defense? I'm not attacking any poster, I'm attacking the pathetic "argument" presented. The opening argument is garbage. No statement of a position or list of supporting evidence or points. If the OP was knowledgable, it would be stated in his words and argument form. Instead, it is copy/paste with the title restated above the paste.

Recognize a weak argument when you see it.

Sent from my NS-P10A6100 using Tapatalk
 
So look at the Alley 2000 paper on the NOAA site right here. In that you will find Alley's 2000 reconstruction as shown below:

View attachment 67205105

Hmmmm... that looks... familiar....

Note Alley's markings of the LIA which ended in 1850, and the distinct uptick after the LIA... what does that data come from in Alley 2000?
Great! You've finally tried to do some honest fact checking from a real source.

Unlike Ball's fakery and dishonesty, there is no false labeling on that graph or any false claims.

So will you finally admit that the dataset for that graph ends in 1855 and that Ball was being deliberately deceptive? Or that is somehow represented global average temperatures?

Here is the dataset: Note the last data point is 95 years before present (1950 is standard date used for 'present' in geology), ie 1855.
So the last 161 years are not shown on that graph.

ftp://ftp.ncdc.noaa.gov/pub/data/pa...gisp2/isotopes/gisp2_temp_accum_alley2000.txt


And here is an interview with Richard Alley on his ice core research:

Reality Check on Old Ice, Climate and CO2
 
Last edited:
Great! You've finally tried to do some honest fact checking from a real source.

Your trolling still isn't helping your argument. Both Ball and Alley's graph plot data after 1850.

Unlike Ball's fakery and dishonesty, there is no false labeling on that graph or any false claims.

Alley plots data after 1850.

So will you finally admit that the dataset for that graph ends in 1855 and that Ball was being deliberately deceptive? Or that is somehow represented global average temperatures?

Here is the dataset: Note the last data point is 95 years before present (1950 is standard date used for 'present' in geology), ie 1855.
So the last 161 years are not shown on that graph.

ftp://ftp.ncdc.noaa.gov/pub/data/pa...gisp2/isotopes/gisp2_temp_accum_alley2000.txt


And here is an interview with Richard Alley on his ice core research:

Reality Check on Old Ice, Climate and CO2

I notice you avoided my question entirely... dodge much?

In Alley's graph there is clearly data graphed well after 1850 when the LIA ended. What is the source of that data that Alley clearly graphed?
 
Last edited:
Your trolling still isn't helping your argument. Both Ball and Alley's graph plot data after 1850.


Alley plots data after 1850.

In Alley's graph there is clearly data graphed well after 1850 when the LIA ended. What is the source of that data that Alley clearly graphed?

Since you seem like such a big fan of Richard Alley (and hey, I can understand - he's a great scientist and scientific communicator!), you might want to see this:

 
Since you seem like such a big fan of Richard Alley (and hey, I can understand - he's a great scientist and scientific communicator!), you might want to see this:

I am not for or against Richard Alley. I am simply asking why Alley graphing data past 1850 is OK and Ball repeating Alley's graph is dishonest. Do you have an answer for where Alley got that data on tail end of his graph that Ball used?
 
I am not for or against Richard Alley. I am simply asking why Alley graphing data past 1850 is OK and Ball repeating Alley's graph is dishonest. Do you have an answer for where Alley got that data on tail end of his graph that Ball used?

I could care less what some amateur doofus wrote on one of Jack's nutjob blogs.

But I do care that Richard Alley is the guy who has a depth of knowledge on this not exceeded by many in the world, and that he strongly feels that Greenland may be at a tipping point of ice melt, that it is certainly antrhopogenically caused, and that we need to act to do something about it before it gets worse.
 
Oh please, enough with the victim card. Is that really your only defense? I'm not attacking any poster, I'm attacking the pathetic "argument" presented. The opening argument is garbage. No statement of a position or list of supporting evidence or points. If the OP was knowledgable, it would be stated in his words and argument form. Instead, it is copy/paste with the title restated above the paste.

Recognize a weak argument when you see it.

Sent from my NS-P10A6100 using Tapatalk

I just saw one from you--and so did everyone else here.
 
Your trolling still isn't helping your argument. Both Ball and Alley's graph plot data after 1850.


Alley plots data after 1850.


I notice you avoided my question entirely... dodge much?

In Alley's graph there is clearly data graphed well after 1850 when the LIA ended. What is the source of that data that Alley clearly graphed?
Wrong again. The last data point is in 1855. You didn't bother to look at the dataset I gave you a link to did you?

Even Anthony Watts himself admits the dataset from the Alley 2000 paper ends in 1855. This is from his blog where he lists some incorrect and disputed graphs that shouldn't be used:

"Any graph that claims to use Alley’s GISP2 data must either finish at 95 years Before Present (BP=1950) or AD1855 because that is the final date in his database which is on-line and freely available to us all. Lappi’s graph mistakes Present for 2000 as does Easterbrook, they should have a note added pointing out their error or be excluded."

https://wattsupwiththat.com/2013/04...te-reference-page-disputed-graphs-alley-2000/

Which begs the question of why he allows people like Tim Ball and Lord Monckton to continue to post fake graphs and use dishonest claims about them in their articles on his blog.

I didn't avoid your question, I provided the dataset to show it was a nonsensical question.

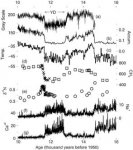
Here are the original graphs from the Alley 2000 paper. Note where it says "thousands of years before 1950" (BP). Go look at the dataset where the last data point is 95 years before 1950. 1950 minus 95 years is 1855. Is that too much of a strain for you?

1-s2-0-s0277379199000621-gr1.jpg

How is presenting facts to show the dishonesty of Ball's (and your) false claims 'trolling'?
 
Last edited:
I could care less what some amateur doofus wrote on one of Jack's nutjob blogs.

But I do care that Richard Alley is the guy who has a depth of knowledge on this not exceeded by many in the world, and that he strongly feels that Greenland may be at a tipping point of ice melt, that it is certainly antrhopogenically caused, and that we need to act to do something about it before it gets worse.

Alley's and Ball's graphs are the same. Both graph data after 1850. You're fist pounding and name calling changes nothing.
 
Back
Top Bottom