• This is a political forum that is non-biased/non-partisan and treats every person's position on topics equally. This debate forum is not aligned to any political party. In today's politics, many ideas are split between and even within all the political parties. Often we find ourselves agreeing on one platform but some topics break our mold. We are here to discuss them in a civil political debate. If this is your first visit to our political forums, be sure to check out the RULES. Registering for debate politics is necessary before posting. Register today to participate - it's free!

Sea Level Projections vs Tide Gauge Data

I like the presentation a lot. The irony is that the empirical data shows minimal if any acceleration.
One of the slides was Galveston which is mostly subsidence.
For any who want to look themselves the data in the slideshow is all here,
Sea Level Trends - NOAA Tides and Currents
 
Sea Level Projection Video

This is a really interesting video, but the primary problem with this type of analysis compared to using projections is the fact that sea level rise depends to some extent upon the occurrence of major events that become more likely over time. For example, if the Greenland ice sheet were to completely melt, something that scientists predict would likely occur after a 2-3 degree rise in global temperature, then the global sea rise would be around seven meters or 24 feet.

The analysis from your video does accurately note that most of the CO2 was added to the atmosphere after 1950, but it fails to mention that CO2 has a roughly 40 year lag between the addition of the CO2 and it's impact on global temperatures. As such, CO2 added in 1950 would only be represented by global temperature increases (and thus the impact on the global sea levels through melting ice and thermal expansion) by 1990. And the CO2 production, 75% of which was added after 1950, was not added in a uniform rate, but at an accelerating rate where each year saw more CO2 being added versus the previous year. And so, we should expect to see an acceleration in the global temperature (and we are) and an acceleration in the global sea levels.

And guess what? We are.
There are numerous problems with the IPCC's catastrophic predictions.
The first problem is that the atmospheric sensitivity to added CO2 appears lower than expected.
The second problem is where in the diurnal cycle the warming is occurring.
Considering that between 65 and 75 percent of the average temperature increase,
is in nighttime lows not going as low, there might not be as much melting going on as predicted.
http://pubs.giss.nasa.gov/docs/1995/1995_Hansen_etal_2.pdf
Lastly the CO2 forcing is an almost instant effect, the latency would only be the time it takes
to become well mixed. At a quantum CO2 is ready to absorb and re emit IR photons,
as soon as it hits ground state. (tens of milliseconds).
The additional amplified feedbacks from the primary CO2 warming have not been verified.
While it is likely some level of positive feedback exists,the amount showing up in the empirical
data appears quite low.
Also alarmist comments like,
if the Greenland ice sheet were to completely melt,
are completely out of the question, it is unlikely we will even be able to achieve
the first doubling of CO2, a second or third would be almost impossible.
 
CO2 has a roughly 40 year lag between the addition of the
CO2 and it's impact on global temperatures.

The sun reaches its zenith at noon every day and after a
lag of a couple hours we reach the warmest part of the day,
and every year the summer solstice occurs and after a lag
of a few weeks we have our warmest days. And you want me
to believe the increase due to CO2 takes 40 years?

Tell someone who's more gullible than I am.
 
The sun reaches its zenith at noon every day and after a lag of a couple hours we reach the warmest part of the day, and every year the summer solstice occurs and after a lag of a few weeks we have our warmest days. And you want me to believe the increase due to CO2 takes 40 years?

Tell someone who is willing to learn about science and not hold onto their previously held beliefs.

I went ahead and fixed that one for you. But here are the sources if you want to actually learn something

Gulf Times, “A Last Chance to Avert Disaster”, available at
www.gulf-times.com/site/topics/article.asp? cu_no=2&item_no=330396&version=1&template_id=46&parent_id=26

ii Institute of Science in Society, “350 ppm CO2 The Target”,
350 ppm CO2 The Target, p.4

iii Science AAAS, ”Earth’s Energy Imbalance: Confirmation and Implications”, available (after free registration) at www.scienceonline.org/cgi/reprint/1110252v1.pdf, p.1

iv NASA, “The Ocean Heat Trap”, available at www.ocean.com, p.3

v NASA GISS temperature record (see NASA: The 12-month running mean global temperature has reached a new record in 2010 -- despite recent minimum of solar irradiance | ThinkProgress)

vi CSIRO, “Sea Level Rise”, available at www.cmar.csiro.au/sealevel/sl_drives_longer.html
 

An answer to: Is the rise in sea levels accelerating?

Guest essay by: Jan Kjetil Andersen There is a well-established consensus concluding that the global sea level has risen over the last century, and that the level continues to rise. However, the question about whether the rate is accelerating or not, is more inconclusive. To cast some light on this, I have analyzed the latest…

So what to make of all this?
I have not made any regression analysis to show whether the small increase is statistically significant or not. I welcome anyone to do that. However, I think the graphs gives a quite clear message even without further analysis; if there is any acceleration, it is infinitesimal.
 
[...So what to make of all this?
I have not made any regression analysis to show whether the
small increase is statistically significant or not. I welcome
anyone to do that. However, I think the graphs gives a quite
clear message even without further analysis; if there is any
acceleration, it is infinitesimal.

The point of the video was to demonstrate the absurdity
of the sea level predictions coming from today's scientists.

It was very well done, but very disappointing that there
have been only 425 views and just one comment in the
month since it was published.
 
Last edited:
Over a year ago Colorado University's Sea Level Research Group CU-SLRG published a new assessment
of acceleration in sea level rise:

Climate-change–driven accelerated sea-level rise detected in the altimeter era

The abstract says:

Using a 25-y time series of precision satellite altimeter data from TOPEX/Poseidon, Jason-1, Jason-2,
and Jason-3, we estimate the climate-change–driven acceleration of global mean sea level over the
last 25 y to be 0.084 ± 0.025 mm/y2.​
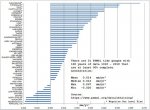
What do the tide gauges say?

An up to date download from the Permanent Service for Mean Sea Level PSMSL data finds that there are
51 tide gauges that have at least 90% complete data for the last 100 years. Calculating the acceleration
over those last 100 years looks like this:

100 years Sea Level Acceleration.jpg

The CU-SLRG paper covers the Last 25 years, and there are 208 tide gauges in the PSMSL that are 100%
complete for that period of time. Calculating for acceleration finds the following:

Mean . . . . . 0.03 mm/yr²
Median . . . .-0.11 mm/yr²
Max. . . . . . 8.43 mm/yr²
Min . . . . . -6.41 mm/yr²
CU-SLRG. . . . 0.08 mm/yr²
So 208 tide gauges tell us that for the last 25 years the acceleration of sea level rise is somewhere between
a negative -0.11 and 0.03 mm/yr² which is at odds with CU-SLRG's 0.8 mm/yr.
 
Back
Top Bottom