Poor Debater
Well-known member
- Joined
- Jul 5, 2015
- Messages
- 961
- Reaction score
- 348
- Gender
- Undisclosed
- Political Leaning
- Undisclosed
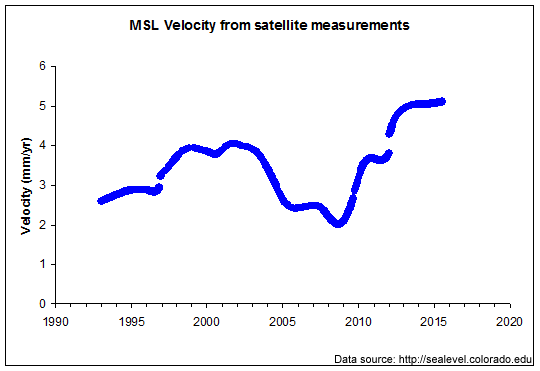
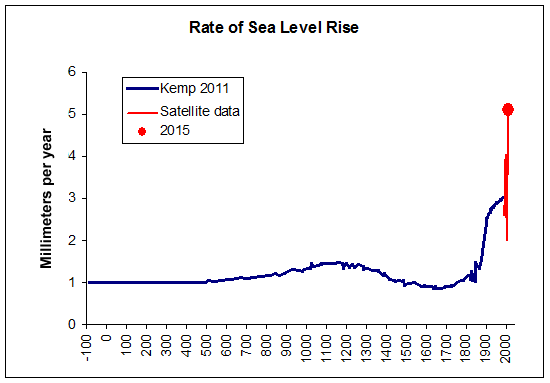
A new study in Proceedings of the National Academy of Sciences confirms that global sea levels are rising faster today than any time during the last 28 centuries, and that human-caused climate change is responsible for at least half of that rise.
We present the first, to our knowledge, estimate of global sea-level (GSL) change over the last ∼3,000 years that is based upon statistical synthesis of a global database of regional sea-level reconstructions. GSL varied by ∼±8 cm over the pre-Industrial Common Era, with a notable decline over 1000–1400 CE coinciding with ∼0.2 °C of global cooling. The 20th century rise was extremely likely faster than during any of the 27 previous centuries. Semiempirical modeling indicates that, without global warming, GSL in the 20th century very likely would have risen by between −3 cm and +7 cm, rather than the ∼14 cm observed. Semiempirical 21st century projections largely reconcile differences between Intergovernmental Panel on Climate Change projections and semiempirical models.