• This is a political forum that is non-biased/non-partisan and treats every person's position on topics equally. This debate forum is not aligned to any political party. In today's politics, many ideas are split between and even within all the political parties. Often we find ourselves agreeing on one platform but some topics break our mold. We are here to discuss them in a civil political debate. If this is your first visit to our political forums, be sure to check out the RULES. Registering for debate politics is necessary before posting. Register today to participate - it's free!

Climate Change: History and Politics

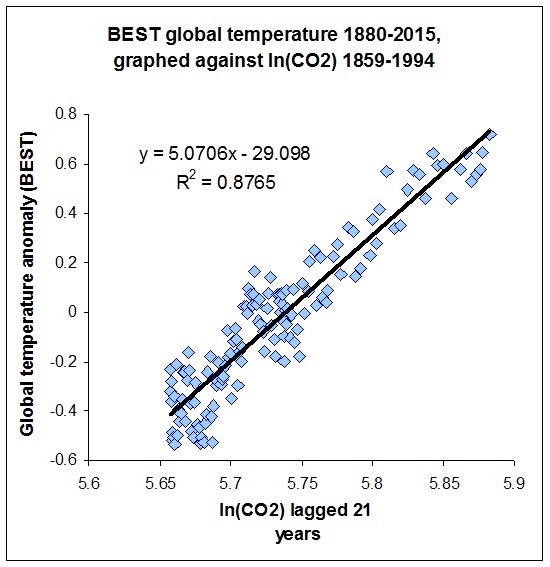
The problem with that methodology is that the spike was 100 years, whereas
60% of the .85 C of observed GISS warming was in that 20 year window.

Any spike that small (.5°) and that short-lived (20 years) would be natural variation, not climate change. The one we're looking at now will last for centuries.
 
Any spike that small (.5°) and that short-lived (20 years) would be natural variation, not climate change. The one we're looking at now will last for centuries.
And yet that spike is what is the basis of you saying,
Yes, but anthropgenic (human-caused) climate change is new,
and it's happening at a much faster pace than any natural climate change ever has.
I actually looked at the GISS record wrong the 1978 J-D is .07 and the 1998 J-D is .63,
So 65% of all the GISS warming occurred within that single 20 year window.
Many of the climate models used the 1978 to 1998 period to try and project future warming,
The assumed that if the CO2 levels continued to increase (as they did) the temperature would follow.
So while a .9 C 100 year spike, may show up using Marcott's methodology.
The current warming trend may not.
 
And yet that spike is what is the basis of you saying,

I actually looked at the GISS record wrong the 1978 J-D is .07 and the 1998 J-D is .63,
So 65% of all the GISS warming occurred within that single 20 year window.
Many of the climate models used the 1978 to 1998 period to try and project future warming,
The assumed that if the CO2 levels continued to increase (as they did) the temperature would follow.
So while a .9 C 100 year spike, may show up using Marcott's methodology.
The current warming trend may not.

The problem with using that particular 20 year window, is they are starting from a biased position. For about 100 years prior, we slowly increased the opacity of the atmosphere with the aerosols from burning in dirty fashions. The EPA and associated regulations started taking effect in the late 70. Over this next 20 years, we cleaned the skies of aerosols almost back to preindistrial times. One study I saw has the swing on atmospheric transmission of solar energy, at a 4% change from the most to the least of atmospheric contaminations. 4% is a great deal of radiative forcing change, which these studies then incorrectly apply as forcing changes from CO2.
 
The problem with using that particular 20 year window, is they are starting from a biased position. For about 100 years prior, we slowly increased the opacity of the atmosphere with the aerosols from burning in dirty fashions. The EPA and associated regulations started taking effect in the late 70. Over this next 20 years, we cleaned the skies of aerosols almost back to preindistrial times. One study I saw has the swing on atmospheric transmission of solar energy, at a 4% change from the most to the least of atmospheric contaminations. 4% is a great deal of radiative forcing change, which these studies then incorrectly apply as forcing changes from CO2.
I agree it is a bad sample, but that period is the basis of the entire concept of AGW.
 
I agree it is a bad sample, but that period is the basis of the entire concept of AGW.

And one reason why it is laughable that people buy into it.
 
I am not sure we can accurately say the current observed changes are at a faster pace
than any natural climate change ever.
The Proxy records like Marcott, et al 2013 clearly state they only have a median resolution of 120 years.
http://content.csbs.utah.edu/~mli/Economics 7004/Marcott_Global Temperature Reconstructed.pdf

It is questionable if the burst of warming observed between 1978 and 1998,
would even show up in the proxy records.

You once again pretend that Marcott is a paper with high resolution proxy data.

PAGES 2K is much higher resolution (and much shorter timeframe) and shows no such spikes.

But that's not covered in the denial blogs you read (but pretend not to), so you ignore it.
 
You once again pretend that Marcott is a paper with high resolution proxy data.

PAGES 2K is much higher resolution (and much shorter timeframe) and shows no such spikes.

But that's not covered in the denial blogs you read (but pretend not to), so you ignore it.

Is that the one that had several hundred sediment proxy samples to use, but only used about a dozen that best fit their agenda?
 
Is that the one that had several hundred sediment proxy samples to use, but only used about a dozen that best fit their agenda?

I don't know, I don't follow denier blogs as closely as you do.

Or did you magically discover this finding on your own using your vast background in paleoclimate science?
 
I actually looked at the GISS record wrong the 1978 J-D is .07 and the 1998 J-D is .63,
So 65% of all the GISS warming occurred within that single 20 year window.

But that's an obvious cherry-pick, since 1978 was a la Niña year and 1998 was an el Niño year. Better to used smoothed values, which is what we would expect from a proxy record anyway. Using a standard LOESS smooth with α=.33, there was .34° of warming between 1978 and 1998. Further, you're very conveniently forgetting that the warming we're currently experiencing has already lasted much longer than the 20 years you're assuming.

You're trying to say that the current warming could just be natural variation, which is like trying to push a rope. Your argument is toast.

Many of the climate models used the 1978 to 1998 period to try and project future warming,
Really? Name two. Citations, please.

The assumed that if the CO2 levels continued to increase (as they did) the temperature would follow.
And it has.
25916494612_ecd68286c6_o.jpg


So while a .9 C 100 year spike, may show up using Marcott's methodology.
The current warming trend may not.

The current warming trend, smoothed, is one full degree in the last 100 years. It would have shown up.
 
But that's an obvious cherry-pick, since 1978 was a la Niña year and 1998 was an el Niño year. Better to used smoothed values, which is what we would expect from a proxy record anyway. Using a standard LOESS smooth with α=.33, there was .34° of warming between 1978 and 1998. Further, you're very conveniently forgetting that the warming we're currently experiencing has already lasted much longer than the 20 years you're assuming.

You're trying to say that the current warming could just be natural variation, which is like trying to push a rope. Your argument is toast.


Really? Name two. Citations, please.


And it has.


The current warming trend, smoothed, is one full degree in the last 100 years. It would have shown up.

I did not select the time period, but got it from a Nature article.
The same section discusses the simulations (plural) used for the IPCC report.
Climate change: The case of the missing heat : Nature News & Comment
Stark contrast

On a chart of global atmospheric temperatures, the hiatus stands in stark contrast to the rapid warming of the two decades that preceded it. Simulations conducted in advance of the 2013–14 assessment from the Intergovernmental Panel on Climate Change (IPCC) suggest that the warming should have continued at an average rate of 0.21 °C per decade from 1998 to 2012. Instead, the observed warming during that period was just 0.04 °C per decade, as measured by the UK Met Office in Exeter and the Climatic Research Unit at the University of East Anglia in Norwich, UK.
Your graph is meaningless, as it lacks a temporal component.
 
I don't know, I don't follow denier blogs as closely as you do.
I don't follow them at all, so admiting that you do, means you follow them more than I!

Or did you magically discover this finding on your own using your vast background in paleoclimate science?
No.

I read the study. I then looked at the data they said they used, and discovered multiple times more data than the few samples they used. I then compared the datafiles, and saw that they used the ones that showed the rise in temperature they were looking for, when the majority of the sampled proxy sites from the same expeditions showed little warming and even cooling on others... They cherry picked their data!

Now I guess I can give them the benefit of doubt, and assume they randomly selected less than 10% of what was available. And that chance had it, they all showed the highest increase among their sister samples...
 
I did not select the time period, but got it from a Nature article.
Obviously not, since "1978" does not appear in the cited article. Care to guess again?

Your graph is meaningless, as it lacks a temporal component.

On the contrary, if CO2 causes temperature rise, then the relationship should be linear regardless of the temporal component. And it is.
 
On the contrary, if CO2 causes temperature rise, then the relationship should be linear regardless of the temporal component. And it is.

No, it will not be linear.

Forcing from CO2 follows a log curve. Now forcing to temperature is near linear at short changes, but it also is not a linear function.
 
Obviously not, since "1978" does not appear in the cited article. Care to guess again?


On the contrary, if CO2 causes temperature rise, then the relationship should be linear regardless of the temporal component. And it is.
On your graph the CO2 and the Temperature could occur anywhere within the time
window, and the data point would be the same.
 
On your graph the CO2 and the Temperature could occur anywhere within the time
window, and the data point would be the same.

Any point not close to the line would imply that the CO2 theory was in trouble. A Lot of points not on the line would be tantamount to falsification. For example, you can do the same kind of graph with solar forcing instead of CO2 forcing. Here it is:

19678296018_7278748d0f_z.jpg


That's fairly convincing.
Only to you, without a time scale the relationship to time is broken.
 
Well if you need a timescale to get it, here you are:

16721662898_39c842a8ec_z.jpg


Got it? Good.
So when you say 25 year lag CO2, do you mean you matched up the 1950 CO2 level with the
1975 temperature, or the 1950 temperature with the 1975 CO2 level?
Also, how would this graph isolate out the natural fluctuations in temperature?
 
So when you say 25 year lag CO2, do you mean you matched up the 1950 CO2 level with the
1975 temperature, or the 1950 temperature with the 1975 CO2 level?

The first is correct. This allows for the thermal inertia of the oceans.

Also, how would this graph isolate out the natural fluctuations in temperature?

It doesn't. It should be abundantly clear from either graph that the natural fluctuations are small compared to the CO2 forcing response.
 
Any point not close to the line would imply that the CO2 theory was in trouble. A Lot of points not on the line would be tantamount to falsification. For example, you can do the same kind of graph with solar forcing instead of CO2 forcing. Here it is:

19678296018_7278748d0f_z.jpg


That's fairly convincing.

Not really, since the temperature records have been corrected so many time.
 
The first is correct. This allows for the thermal inertia of the oceans.


It doesn't. It should be abundantly clear from either graph that the natural fluctuations are small compared to the CO2 forcing response.
Part of the issue, is that some people like Dr. David Evans, can show the same type of response
just to the changes in TSI.
https://cbdakota.files.wordpress.com/2014/07/evanstotal-solar-irradiance-1-1.gif
There is a lot of noise in the signal, and the adjustments only added additional noise.
 
Not really, since the temperature records have been corrected so many time.

Which brings us once again to:

The Question No Denier Dares To Answer!

What's your recommendation? Leave a known bias in the data? Or correct the data to remove the bias?

Asked sooooo many times. Ducked by the denizens of Denierstan, Every. Single. Time.
 
ZOMG! Banned from WUWT??? He must be an utter nutter. Unless you've actually read the comment threads on WUWT, when you come to the swift realization that the utter nutters are the only ones they allow to stick around. Anthony Watts Does Not Take Criticism Of Any Kind.

Actually, that's not only false but is 180 degrees off. WUWT allows much more opinion diversity than do warmist sites, especially Real Climate.
 
Which brings us once again to:

The Question No Denier Dares To Answer!

What's your recommendation? Leave a known bias in the data? Or correct the data to remove the bias?

Asked sooooo many times. Ducked by the denizens of Denierstan, Every. Single. Time.

What to do? That's a simple question and most critical minds that have looked at the economic math will say the same.
 
Back
Top Bottom