- Joined
- Jun 4, 2015
- Messages
- 5,849
- Reaction score
- 2,426
- Gender
- Male
- Political Leaning
- Liberal
You can't deduce complex interactions with basic physics.
But you can reject a complex interaction based on a lack of understanding basic physics.

You can't deduce complex interactions with basic physics.
But you can reject a complex interaction based on a lack of understanding basic physics.
You can't deduce complex interactions with basic physics.
The portion of the warming we know from basic physics (If you use the IPCC's numbers for CO2 direct response),
is 1.73*ln(400/280)=.617C.
Any attribute beyond that is not physics, but speculation based on a hypothesized amplified feedback.
I am perfectly capable of forming my own opinion. I understand the basic physics in play and I understand and have analyzed the various arguments for and against this topic. With that said, I also fully recognize that I am not an expert in this complex field and I will thus be well served by actually listening to those who are experts in the field. And more specifically, I will choose to listen to the opinion of multiple experts, as opposed to just one or two.
Do you trust the medical advice of your doctor when it comes to treating cancer - particularly when that advice is supported by the overwhelming research into the field? Or do you just "form your own opinion?"
As the posted graph shows, feedback is measured, and found to be strongly positivie. It's not hypothetical at all.
Don't believe it? Then please explain why the slope of the graph is around +4, if there is no feedback. Because it's quite clear from the graphed data that climate sensitivity to doubled CO2 must be ln(2) times the slope, or .6915 × 3.8952 = 2.7° per CO2 doubling.
If the physics is so basic why can you not deal with it? Or was the line "basic physics" just a put down to those who can actually understand it?
Given your ability with physics what would you expect the thermal expansion of the ocean to be from a 1 Zeta joul of energy going into the world's oceans over 1 year? Please feel free to make any reasonable assumptions and be very basic, high school style with the answer. I don't even need you to do the actual sum but simply illustrate that you are able to understand how to do it. This will tell if you actually know any physics or are without a clue as a lot of alarmists are.
No, but simple interactions you can. CO2 is transparent to visible light, where the Sun predominantly radiates, and is opaque in infrared, where the Earth radiates. It's a greenhouse gas. More CO2 makes the surface warmer. Simple physics, supported by clear data.
We do not know all of the variables in our climate system.
Showing CO2 is the lone variable, is likely not reflective of reality.
We know that since 1880 the TSI has increases by .87 Wm-2.
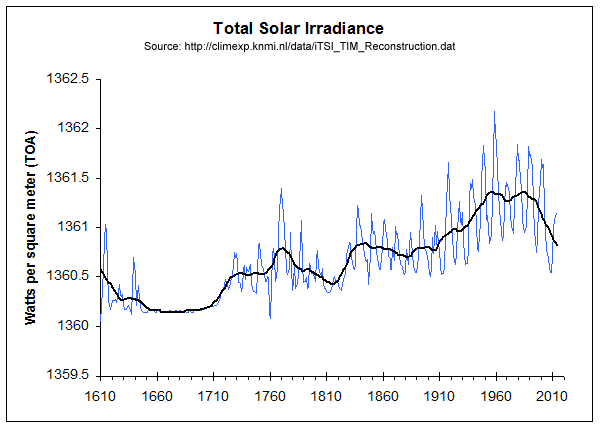
TSI 1880 1360.42 Wm-2We've got the big ones nailed, and that's more than adequate for policy decisions.
So now you're complaining that I need more modeling for you to believe it? Riiiiight.
That's not even close to being true.
And don't forget that these data are TOA, not surface. To convert to climatologically significant forcing, you need to multiply by .7 (albedo) and then by .25 (sphericity).
Yea...no thanks. I don't consider that type of question to fall under "basic physics." But if you would like to educate me on how much thermal expansion you should expect to see from 1 zettajoule's worth of energy over the course of one year, feel free. I am genuinely curious to hear from someone who can actually understand it.
Debater is correct in that it is actually 0.87 x 0.25 x 0.7.TSI 1880 1360.42 Wm-2
TSI 2013 1361.29 Wm-2
Delta .87 Wm-2.
LISIRD - Historical Total Solar Irradiance
I know, the TOA number looses a lot on the way down, Sandia labs has a good white paper on it.Debater is correct in that it is actually 0.87 x 0.25 x 0.7.
Thing is, the oceans respond more than just the basis radiative calculations. the warmers refuse to acknowledge real science.
They are putting the number at about 12% reaches the surface, but changing the inputHence,the time-and-space-averaged solar flux striking the outer atmosphere of the earth is
(1.37 kW/m2) / 4 = 342.5 W/m2. In addition, en route to the earth’s surface, about 30% of
this flux is scattered,and about 19% is absorbed, by the atmosphere and clouds
(Wallace 1977, pp. 320-321). Hence,the average flux striking the earth’s surface is
342.5 W/m2 · (1-0.49) = 174.7 W/m2.
Yes.They are putting the number at about 12% reaches the surface, but changing the input
changes the amount to work with. CO2 in theory can only react with photos that are present.
No, you're assuming it doesn't, on the basis of zero evidence.Again, no, you are assuming that simple lab data applies in a complex climatic system. It doesn't.
In the same way you can't take a simple measure of heat retention of CO2 from a lab and apply it directly to the complex atmosphere because the behavior of the various elements of the atmosphere and climate are more dynamic than the lab. In fact, the whole underpinning of the CAGW scare mongering is that CO2 in the atmosphere does NOT behave like CO2 in the lab, and that the net forcing caused by CO2 is greater than what could be attributable just to the CO2 alone (doubling in the lab leads to 1.3C or there abouts, the IPCC claims the doubling would lead to between 2.0-4.0C).
It does!Ironically, if CO2 behaved in the atmosphere the way it does in the lab
Yeah, I don't often stoop to ad-hom arguments, but I'll make an exception in this case. Lord Monckton is a buffon and a charlatan who thinks he's cured AIDS. He's frequently been caught red-handed citing sources that don't actually say what he claims they say, and when confronted on such dishonest tactics, he threatens to sue for libel. So far, scads of threats and zero lawsuits. The man is flat-out dishonest.then the projection of future warming would be closer to the skeptics prediction than to the doomsayers. Lord Monkton, for example, calculates that the doubling would be closer to 1.6C, still higher than lab, but low enough to not be catastrophic.
Moreover, accepting the complexity of the Earth's environment the skeptic would argue that CO2 contributes X amount of temperature above the natural climate variability, so saying that CO2 will increase in the future, to a skeptic, is not a claim that it will be warmer in the future than it is today... only that it will be warmer in the future than it otherwise would have been in the future.
For this reason Skeptics see no reason for immediate and catastrophic action to the world economy because any CO2 warming in the future can not be considered bad or good. If the next LIA is 1.6C warmer than it should have been then that is a GOOD thing.
No, you're assuming it doesn't, on the basis of zero evidence.
Nope, you're confusing forcing with sensitivity. The forcing of CO2 is well known, and like all forcing it's measured in Watts per square meter, and can be determined from quantum mechanics or laboratory measurement. The sensitivity of the climate is how much temperature changes for a given amount of forcing regardless of the type of forcing. These days, sensitivity is conventionally measured in degrees C of change per 3.8 W/m² of forcing, because that's how much forcing a doubling of CO2 will cause. Sensitivity is a lot fuzzier and an ongoing area of research. But 1 W/m² of CO2 forcing will cause just as much warming as 1 W/m² of solar forcing, or any other kind of forcing, regardless of what sensitivity turns out to be.
Because forcing is easy to determine, we know that humans are responsible for essentially all the global warming since the mid 20th century. (Actually more than 100%, since solar forcing has been declining since then and would have cooled the planet in the absence of human activity). And CO2 is by far the largest source of manmade forcing.
Sensitivity cannot be measured in the lab, and the 1.3°C figure you cite is derived from theory (i.e., from models). However, sensitivity can be measured in the real world, and the graph I posted is one way to do that: to find sensitivity to doubled CO2 from the graph, take the slope of the regression line and multiply by ln(2): 3.8954 × .69315 = 2.7°C per doubling.
It does!
Yeah, I don't often stoop to ad-hom arguments, but I'll make an exception in this case...
If you want to have credibility with me, you need to cite peer-reviewed science.
That would only be true if natural variability accounted for substantially more climate change than CO2 does. But the data shows that we passed that point decades ago. In fact, if you look at the posted graph, it's quite clear that after accounting for CO2, the remaining natural annual variability is about ±0.2°C, while we're currently about 1°C above pre-industrial temps.
And what makes you think that global warming is going to magically stop at 1.6°C?
THe failure of the models derived from the primacy of CO2 in Earth climate is all the evidence I need as a skeptic. The CAGW people are the ones that need to prove something.
Sorry, I used "net forcing" rather than sensitivity. But sensitivity if the derived fudge factor used in models that applies greater effective green house effect to CO2 that is observable in the lab.
It is indeed "a lot fuzzier" than forcing, but unfortunately it is the entire foundation of CAGW.
And the fact that those models that replicate current climate best have the highest sensitivity should tell you that what we need to know is potentially catastrophic.The fact that from model to model the "sensitivity" is different tells you all you need to know.
So when I said CO2 is "by far the largest", how did that come to be translated as "the one and only" in your mind?No, you have now posited the idea that climate is driven by only TWO factors (the sun and CO2). Even the simplest of CO2 models doesn't make that argument. The idea that everything not attributable to solar variation is therefor CO2 is just plain ignorant.
Because it can be measured empirically. And has been. As the graph shows, and as you have not refuted.Again, since sensitivity can not be measured "in the lab" and is not an agreed on value it is not very valuable to science or policy making.
Not according to CAGW theory. That is what "sensitivity" is supposed to represent.
But the LIA ended a just before the industrial revolution, so is your argument that we should still be in the grips of the LIA? If so then HOORAY for AGW!
I'm not actually making an argument for either direction in climate in the future. I can say that based on the characteristics of CO2 as a GHG it will have an increasing weaker impact on climate regardless of what we do. CO2 GHG response is logarithmic and if the first double results in 1.6°C then we will need to ad 400% the amount of CO2 that we have added since the beginning of the Industrial revolution to achieve the the next 1.6°C.
Actually, climate models have a 30+ year record of being right. Here's what Exxon's climate model was predicting in 1982:
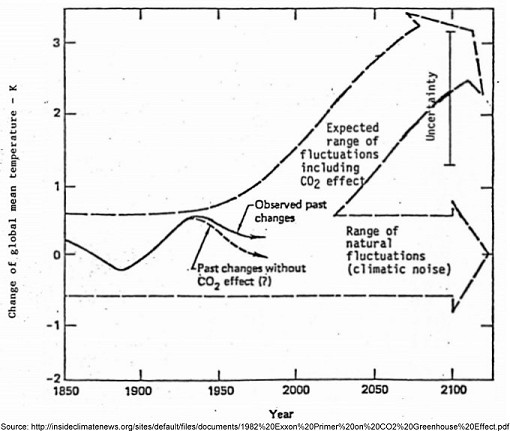
And here's what actually happened:
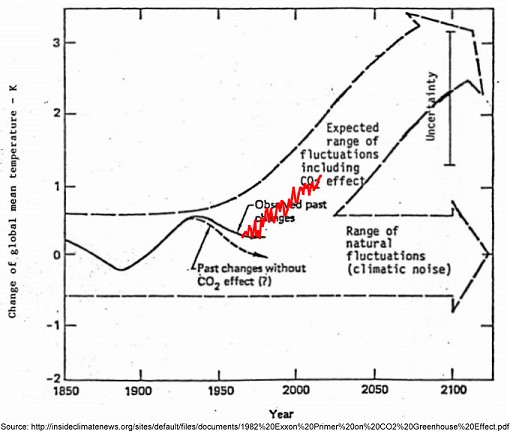
Bullseye.
The total change in TSI (that's Total Solar Irradiance) between the Maunder Minimum and the Grand Maximum of 1958 was 1.26 W/m² after smoothing; but that's a TOA (Top Of Atmosphere) number, which is a climatological 0.22 W/m² of climate forcing. The change in CO2 forcing between 1750 and today is 1.9 W/m², more than eight times greater.
"Bullseye"? You are being lied to. The global temperature anomaly has been about 0.5C since 1960, the graph that you have presented stretched that 0.5 to 1.0 in order to get the line to run up the middle of the projection.
At least try to check the work of the data you present, this took me all of 10 seconds to debunk.
Except that nobody is arguing that the solar radiation is all that is involved in solar variance as a driver of climate. It is no secret that solar variance and global climate are highly correlated throughout history, those who accept this aren't trying to argue the sience is settled like the CAGW side is. They simply accept that thereis a correlation and have set out to find out why solar variance appears to have a greater effect on climate than the base forcing would suggest. You know, real science.
Nope, you're confusing forcing with sensitivity. The forcing of CO2 is well known, and like all forcing it's measured in Watts per square meter, and can be determined from quantum mechanics or laboratory measurement. The sensitivity of the climate is how much temperature changes for a given amount of forcing regardless of the type of forcing. These days, sensitivity is conventionally measured in degrees C of change per 3.8 W/m² of forcing, because that's how much forcing a doubling of CO2 will cause. Sensitivity is a lot fuzzier and an ongoing area of research. But 1 W/m² of CO2 forcing will cause just as much warming as 1 W/m² of solar forcing, or any other kind of forcing, regardless of what sensitivity turns out to be.
"Bullseye"? You are being lied to. The global temperature anomaly has been about 0.5C since 1960, the graph that you have presented stretched that 0.5 to 1.0 in order to get the line to run up the middle of the projection.
Except that nobody is arguing that the solar radiation is all that is involved in solar variance as a driver of climate. It is no secret that solar variance and global climate are highly correlated throughout history, those who accept this aren't trying to argue the sience is settled like the CAGW side is. They simply accept that thereis a correlation and have set out to find out why solar variance appears to have a greater effect on climate than the base forcing would suggest. You know, real science.
Nope. Sorry.
The forcing is the amount of energy change due to CO2 or whatever. OK so far.
The temperature change is sort of directly related to that. The idea that the oceans are absorbing more energy now thanthey did 15 years ago despite no change in temeprature is silly.

The sensitivity of x temperature change due to a doubling of CO2 should be the same as the sensitivity of x watts per square meter due to a doubling of CO2.
You've been misinformed. Climate models have been remarkably accurate. See my post #16 on this thread.
You've been misinformed again. In modern climate models, sensitivity is an output from the model, not an input. No fudge factors. Further, many climate models these days are open source, so you don't have to take my word for it.
But fortunately it can be measured empirically, and those measurements fall right in line with the IPCC's likely range. Further, you have not shown in any way that those measurements are wrong.
And the fact that those models that replicate current climate best have the highest sensitivity should tell you that what we need to know is potentially catastrophic.
So when I said CO2 is "by far the largest", how did that come to be translated as "the one and only" in your mind?
Because it can be measured empirically. And has been. As the graph shows, and as you have not refuted.
Having claimed that you didn't really confuse forcing with sensitivity, you now proceed to once again confuse forcing with sensitivity. Nice. Please cite one paper, by anyone, which states that CO2 should behave differently in the atmosphere than in laboratory measurements.
This is your idea of peer-review? Scientific Online is a pay-to-publish paper mill. They'll put up anything anyone pays them to. Seems likely to me that Herr Harde failed peer-review, so he paid to have it published anyway.
So now you agree that your prior point about GW not being less than natural variation was, in fact, wrong? Looks like we're making progress, an inch at a time.
Which is why the graph I posted used ln(CO2) on the horizontal axis. You remember -- the graph that shows empirical sensitivity at 2.7°C? The graph you haven't refuted?
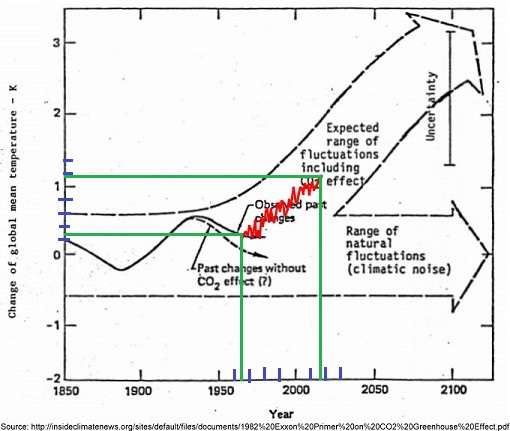
NASA GISS temperature 1960: -0.03°
NASA GISS temperature 2014: +.74°
Change since 1960: +.77°
So yeah, it's still a bullseye.
At least try to check the data you present, this took me all of 10 seconds to debunk.
If you accept that solar forcing is a small fraction of the change in all forcing since 1900, then you have already accepted that CO2 is the primary driver of climate change since then. So we're done here.