• This is a political forum that is non-biased/non-partisan and treats every person's position on topics equally. This debate forum is not aligned to any political party. In today's politics, many ideas are split between and even within all the political parties. Often we find ourselves agreeing on one platform but some topics break our mold. We are here to discuss them in a civil political debate. If this is your first visit to our political forums, be sure to check out the RULES. Registering for debate politics is necessary before posting. Register today to participate - it's free!

Another month into 2015, another warmest month on record

You know, I seem to remember this being the umpteenth time that you referred to me as a parrot. This despite the numerous intelligent conversations that we've had on the topic. And I have already warned you multiple times. So do me a favor and apologize or stop replying to my posts. I have decided to do the same.


Nobody has yet provided empirical linkage between rising CO 2 and rising temperature and (as illustrated) the ice core record shows it has been warmer than today in the recent past minus SUVs

Given we do not begin to know the Climate sensitivity of CO2 and that temperatures have flatlined I think it might be a bit premature to deconstruct the fundamentals of our entire economy just yet on the basis of a hunch.
 
You know, I seem to remember this being the umpteenth time that you referred to me as a parrot. This despite the numerous intelligent conversations that we've had on the topic. And I have already warned you multiple times. So do me a favor and apologize or stop replying to my posts. I have decided to do the same.

I'll tell you what.

I'm sorry for losing my temper. I just get so frustrated with the ideas people get, that are not based in real science. It doesn't help that you use a 15 year old CO2 ice core chart to try to make a point. A point that fails relevance because you are assuming the sensitivity of CO2 is not in question.


Consensus is not science. Carefully worded questions and carefully worded responses that remain ambiguous are rampant in the climate sciences. I don't know how many times I have pointed out aspects of ambiguity, and people simply never listen to. If you are already convinced that the pundits are correct, and already have your mind closed, then why should I take any time trying to convince you otherwise?

Seriously. Stop taking the word of blogs like Skeptical science as fact. All you are doing is listening to pundits that don't know any more about the climate sciences than others who are not climatologists. Again, only one person that writes in that blog is a climate scientist. The rest are like a help center that just references scripted material. The scripted material of someone with an agenda. I doubt any of them know more than those of us in this forum who have actually done research ourselves.
 
Listen, you are trying to put the blame for the current warming trend on the most obvious, and thus, the most easily measured variable available. If the solar output were the primary reason for the warming planet, then that information would be widely available and enough climatologists would raise their voice to dismiss AGW as a theory.

The facts are that scientists are perfectly capable of measuring and attributing the warming patterns to the solar activity. Solar Activity does not explain the current warming trend. Greenhouse Gases do explain that trend and here is the other issue: Humans can not control the Sun; however, we can control the non-natural overproduction of Greenhouse Gases that also lead to the current warming trend. Humans have to accept that we are unable to control a lot of natural variables, but we can control our pollution.


Right...

That is a valid and supportable point of view. No the only one, though.

What has been the historical measure of the Solar output?

<snip>

SolarIrradianceReconstructedSince1610%20LeanUntil2000%20From2001dataFromPMOD.gif

Solar irradiance since 1610 as reconstructed by Lean et al (1995) and Lean (2000), until 2000. From 2001 data from PMOD/WRC are used. The thin line indicates the annual reconstructed solar irradiance, while the thick line shows the running 11 average. The values shown include a background component. See Lean (2000) for discussion of the amplitude of the background component. See Fröhlich (2000, 2003)for a description of the PMOD data. Last year shown: 2014. Last diagram update: 26 May 2015.


Here is a chart comparing the real world temperatures to the rise of CO2 for the very recent period.

<snip>

AllCompared%20GlobalMonthlyTempSince1958%20AndCO2.gif

Superimposed plot of five different global monthly temperature estimates shown individually elsewhere. As the base period differs for these estimates, they have all been normalised by comparing to the average of their initial 120 months (10 years) from January 1979 to December 1988. Click here to go to the associated comparison of these five temperature records. The heavy black line represents the simple running 37 month (c. 3 year) mean of the average of all temperature estimates (before 1979 only the three surface records). The blue graph shows the amount of atmospheric CO[SUB]2[/SUB] (Mauna Loa station, Hawaii, see also above). The heavy blue line represents the simple running 37 month (c. 3 year) mean of the monthly CO[SUB]2[/SUB]-values. The scale for atmospheric CO[SUB]2[/SUB] (right) is adjusted to display the CO[SUB]2[/SUB]-graph roughly parallel to the 1975-2000 temperature increase. For the first two decades in the 21[SUP]st[/SUP] century a warming of about 0.2°C per decade is projected for a range of SRES emission scenarios according to the 2007 IPCC Summary for Policymakers (p.7 and Fig.SPM.5). Last month shown: September 2015. Last diagram update: 30 October 2015.

<snip>

If CO2 is the DOMINANT factor in the control of the climate, then controlling that should yield the effects you are seeking.

If not, all it does in make YOU fell good while costing ME money.

I feel there are various reasons to reduce the use of fossil fuels, the main one being that they will run out at some point in the future. The changeover to alternatives will occur naturally as other power sources are discovered and become economically viable.

However the main anthropogenic connection between climate and CO2 seems to be the PR connection that CO2 drives the climate.

Whatever else is true about the connection of CO2 to climate, this is also true:

Every ice age, EVERY ICE AGE, started when CO2 was at its peak in that particular interglacial. As long at that is true, and it is true for ever and ever in every case every time, the dire consequence predictions of the runaway global warming will be empty.
 
Every ice age, EVERY ICE AGE, started when CO2 was at its peak in that particular interglacial. As long at that is true, and it is true for ever and ever in every case every time, the dire consequence predictions of the runaway global warming will be empty.

Uh...this is really poor logic. The reason that "every ice age started" when CO2 was at its peak is because you're defining ice age as the time when the temperature starts to decrease. And temperature starts to decrease once the CO2 starts to decrease.

Think about it this way: Each year since like 1900 the CO2 concentration has gone higher. So, if we used your extremely simplistic version of cause and effect, that means that every year since 1900 should have been the start of an ice age.


I don't know how you can support this. The natural process of CO2 rise and fall is based on Science, not religion.

When warming occurs, permafrost melts and sequestered CO2 is emitted into the air.

When cooling occurs, the atmospheric CO2 is sequestered and the concentration falls. That is why it drops when Ice ages begin. The rise of CO2 in nature after the concentration rises above the very minimums is the effect, not the cause of warming.

That is WHY the fall of the concentration FOLLOWS the fall of temperature.

The lag time seems to be somewhere between hundreds of years and a thousand years.

CO2 Temperature Correlation.jpg
 
I don't know how you can support this. The natural process of CO2 rise and fall is based on Science, not religion.

When warming occurs, permafrost melts and sequestered CO2 is emitted into the air.

When cooling occurs, the atmospheric CO2 is sequestered and the concentration falls. That is why it drops when Ice ages begin. The rise of CO2 in nature after the concentration rises above the very minimums is the effect, not the cause of warming.

That is WHY the fall of the concentration FOLLOWS the fall of temperature.

The lag time seems to be somewhere between hundreds of years and a thousand years.

View attachment 67192222

Each year since like 1900 the CO2 concentration has gone higher. So, if we used your extremely simplistic version of cause and effect, that means that every year since 1900 should have been the start of an ice age.

Also, no, CO2 does not lag behind temperature. It is more accurate to note that part of the CO2 change occurs, then temperature starts to change, which exacerbates CO2 release/sequestration, which leads to more of a temperature change.

So you are sticking with the idea that CO2 changes is what causes ice ice ages?
 
So you are sticking with the idea that CO2 changes is what causes ice ice ages?

No, I am not saying that CO2 causes ice ages. I am saying that CO2 increases precedes temperature increases.
 
No, I am not saying that CO2 causes ice ages. I am saying that CO2 increases precedes temperature increases.

It works both ways. One response is simply faster than the other. In and out of the ice ages however, have SST (sea surface temperature) causing CO2 level changes.

As the SST changes, the net CO2 flux changes. As the SST warms, the ocean becomes a net source of CO2... that is, when other factors aren't changing the balance. As the SST cools, the ocean becomes a net sink of CO2. This equalization process however, through large climate changes like going between ice ages is about 800 years long for most the equalization to occur. This is where we see the approximate change from ~180 ppm during ice ages to ~280 ppm in warm eras. Since this is such a long process, the oceans cannot absorb our added CO2 fast enough. As it is now, they do absorb around half of what we emit. It has to do with partial gas equilibrium, which is primarily affected by temperature.

Between the ocean and atmosphere, the oceans hold about 98% of the CO2. If it was CO2 alone, it wouldn't be so high of a percentage. The partial pressure is low, but the oceans are very massive compared to the atmosphere. CO2 storage is primarily in three chemical states, CO2 is normally intermixed with carbonic acid when using a Bjerrum plot. We have carbonic acid (H[SUB]2[/SUB]CO[SUB]3[/SUB]) (~0.5%) which the CO2 readily forms into, bicarbonate ions (HCO[SUB]3[/SUB]-) (~89%), and carbonate ions (CO[SUB]3[/SUB][SUP]2[/SUP]-) (~10.5%). This is at 15 C and a salinity of 35.

Anyway, Henry's law defines the CO2 ratio equitation between the oceans and atmosphere, and it too is dependent on other variables. Temperature, pH, and salinity define what the equalization constant will be.

If we assume an average 15 C for SST, then at 0 C at the poles, the absorption is about double The polar areas are a net sink. The absorption is about half at about 36 C. the equatorial waters are a net source.

The SST dominated the atmospheric CO2 levels, until we came along and started burning fossil fuels.

Now to claim CO2 changes the temperature is very likely correct, but minor. The degree to which this happens depends on what the actual equalized sensitivity of CO2 is. This science is still not settled, and papers out there claim a pretty large range, included a few that claim it cools more than warms. It was about a dramatic average SST that increased the atmosphere by 100 ppm. Our 120 ppm increase is minor, maybe insignificant in temperature change compared to that natural change.

The most recent papers investigating CO2 sensitivity have it under one degree. One of them, something like 0.53 degrees for a doubling at equalization. In reading that paper some time back, I trust the range is closer to that 0.53 degrees. Past papers that claim the direct 1.2 C (and up to 8+ equalized) used correlation without properly accounting for all of today's known variables.

Wow...

Tired of proof reading. Hope I got this all right...
 
Last edited:
Sorry to interrupt guys, but wouldn't it make sense to see what one of the main experts who actually did the ice-core research says?

The second 2009 AGU lecture is longer and more detailed, but the first shorter lecture from the National Academy of Sciences Symposium this year mentions more recent work since 2009. Both are very informative.

Professor Richard Alley lecture at the National Academy of Sciences - 2015 Symposium


Professor Richard Alley lecture at the AGU conference 2009


Here is Alley's CV.
Curriculum Vitae - Richard Alley
 
Last edited:
Sorry to interrupt guys, but wouldn't it make sense to see what one of the experts who did the ice-core studies says?

Professor Richard Alley lecture at the National Academy of Sciences - 2015 Symposium


Professor Richard Alley lecture at the AGU conference 2009


Here is Alley's CV.
Curriculum Vitae - Richard Alley


Do you think anyone will sit down for almost 1-1/2 hours of video? I'm not going to. I have better things to do, and have studied such things already.

When you present something like that, please time index and summarize relevant points.

Since you like Richard Alley, you might like this:

http://www.nature.com/ngeo/journal/v4/n8/full/ngeo1194.html
 
No, I am not saying that CO2 causes ice ages. I am saying that CO2 increases precedes temperature increases.

You seemed to have said that CO2 decreases preceded cooling in the ice age-interglacial cycles.

Absent any impact from humans, the causal link has been (in the overwhelming majority of examples) that warming or cooling preceded the resulting change in the concentration of CO2.

There have been only about three instances when there might have been a reversal of this causal chain in a Global big climate changes.

Do you have a link that demonstrates your assertion?
 
Climate News
[h=1]The Pause lengthens again – just in time for Paris[/h] No global warming at all for 18 years 9 months – a new record By Christopher Monckton of Brenchley As the faithful gather around their capering shamans in Paris for the New Superstition’s annual festival of worship, the Pause lengthens yet again. One-third of Man’s entire influence on climate since the Industrial Revolution has occurred…

Greetings, Jack. :2wave:

The following is perhaps the most interesting comment in the above post, IMO: "recent extreme weather events cannot be blamed on global warming because there has been no global warming to speak of. It's as simple as that." It sounds like the gauntlet has been thrown down! It will be interesting to read how they will explain the pause in global warming for 18 years 9 months - or can they just ignore it without looking biased?

Greetings Polgara.:2wave:

Data is a hard master.
 
18 years and 9 months.

That sounds.....rather specific. Those kind of arbitrary-sounding cutoffs make me think they weren't so arbitarily picked.


What happens to the line of best fit if we look at 15, 20, 25, 30, 35,40, 45, 50, 100, 200, and 1,000 years respectively?
 
18 years and 9 months.

That sounds.....rather specific. Those kind of arbitrary-sounding cutoffs make me think they weren't so arbitarily picked.


What happens to the line of best fit if we look at 15, 20, 25, 30, 35,40, 45, 50, 100, 200, and 1,000 years respectively?

Well if you were to do that you find our temperatures to be well within natural variability and that all the current hype is just that ...... hype !

Medieval Warm Period
 
18 years and 9 months.

That sounds.....rather specific. Those kind of arbitrary-sounding cutoffs make me think they weren't so arbitarily picked.


What happens to the line of best fit if we look at 15, 20, 25, 30, 35,40, 45, 50, 100, 200, and 1,000 years respectively?

The line changes based on what endpoints are chosen. All graphs showing temperature data ,by definition ,have an arbitrarily determined endpoint.
The point to be made withe almost year pause is that it the concept of a pause is widely accepted, even within the warmist community.

In real science , this would just be chalked up to a small sample size.( 18 years) .In climate science, where we have to ACT NOW BEFORE IT's TOO LATE!!!-a pause is very inconvenient.
 
In real science , this would just be chalked up to a small sample size.( 18 years) .In climate science, where we have to ACT NOW BEFORE IT's TOO LATE!!!-a pause is very inconvenient.

Talking about 'inconvenient' didn't Al Gore say the Arctic should have melted away by now ? :cool:
 
18 years and 9 months.

That sounds.....rather specific. Those kind of arbitrary-sounding cutoffs make me think they weren't so arbitarily picked.


What happens to the line of best fit if we look at 15, 20, 25, 30, 35,40, 45, 50, 100, 200, and 1,000 years respectively?


all of the small numbers you list show a trend of warming. 15 is a slower rate than the rest.

1000 is just about a wash.

2000 shows warming.

5000 just about a wash.

8000 shows cooling.

Comparisons to the peaks of any other interglacial, ANY OTHER INTERGLACIAL, show cooling.

You have put your finger on the swindle. Cherry picking start points from the coldest part of this interglacial, the requirement for the AGW Faithful, warming is indicated. looking at the big picture, the only thing provable is that climate changes.

VostokTemp0-420000%20BP.gif

Fig.2. Reconstructed global temperature over the past 420,000 years based on the Vostok ice core from the Antarctica (Petit et al. 2001). The record spans over four glacial periods and five interglacials, including the present. The horizontal line indicates the modern temperature. The red square to the right indicates the time interval shown in greater detail in the following figure.
 

Attachments

  • CO2 Temperature Correlation.jpg
    CO2 Temperature Correlation.jpg
    20.6 KB · Views: 27
Blockbuster: Are hot days in Australia mostly due to low rainfall, and electronic thermometers not CO2?


Blame dry weather and electronic sensors for a lot of Australia’s warming trend…

In this provocative report, retired research scientist Bill Johnston analyzes Australian weather records in a fairly sophisticated and very detailed way, and finds they are “wholly unsuitable” for calculating long term trends. He uses a multi-pronged approach looking at temperatures, historical documents, statistical step changes, and in a novel process studies the way temperature varies with rainfall as well.
His two major findings are that local rainfall (or lack of) has a major impact on temperatures in a town, and that the introduction of the electronic sensors in the mid 1990s caused an abrupt step increase in maximum temperatures across Australia. There will be a lot more to say about these findings in coming months — the questions they raise are very pointed. Reading, between the lines, if Johnston is right, a lot of the advertised record heat across Australia has more to do with equipment changes, homogenisation, and rainfall patterns than a long term trend.
“Trends are not steps; and temperature changes due to station changes, instruments and processing is not climate change”, he said. “The Bureau are pulling our leg”.
The years when more rain falls are more likely to be years without high maximums. Bill Johnston finds that for every 100mm of rainfall, the maximum temperatures were about a third of a degree cooler.
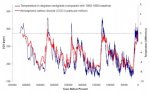
On the left hand side, the step ups in temperature are shown. Electronic sensors were introduced in the mid 1990s. The right hand graphs show how rainfall keeps maximum temperatures cooler. (Data is grouped “a,b,c” between the steps).

Johnston uses these rainfall correlations as a tool to check the quality of temperature records. When combined with step change analysis, he finds that unrecorded site moves or station changes are common. When the automatic sensors were introduced temperatures suddenly jump up, and their relationship with rainfall breaks down.
“Fleeting parcels of hot air, say from passing traffic or off airport runways, are more likely to be sensed by electronic instruments than by thermometers”, he said.

Automatic weather stations (AWS) were introduced across Australia’s network within a few years. Because so many stations made the switch around the same time, homogenization procedures don’t detect their bias, and assume a natural step up in warming occurred. Worse, the artificial warm bias is transferred to stations that are not automated, reinforcing trends that don’t exist!
“Homogenisation is nonsense, and an open public inquiry into the Bureau’s activities is overdue”, he said.​
The Bureau must be audited. Stations should not be homogenized until they are analyzed individually. And the analysis should start with site inspections and a detailed historical account of what is known about each site.
“The Bureau has scant knowledge about many important sites”, Bill said, “and some of what they claim cannot be trusted”. . . .

 
Part of this temperature vs. precipitation show that we need to stop looking at warming from just a radiative forcing aspect. Like I pointed out with the solar/ocean/atmosphere coupling, we need to look at heat content. Clouds and rain have a dramatically different heat content than a static atmosphere or averaged atmosphere. Radiative forcing and its effect of water, plants, and the various solid surface types, varies greatly with their heat capacity, emissivity, albedo, opacity, etc. and also different at various spectra.

The minimal forcing change at spectra open for changes from increased CO2 has cannot explain what the alarmists claim it does.
 
Back
Top Bottom