• This is a political forum that is non-biased/non-partisan and treats every person's position on topics equally. This debate forum is not aligned to any political party. In today's politics, many ideas are split between and even within all the political parties. Often we find ourselves agreeing on one platform but some topics break our mold. We are here to discuss them in a civil political debate. If this is your first visit to our political forums, be sure to check out the RULES. Registering for debate politics is necessary before posting. Register today to participate - it's free!

Did James Hansen Unwittingly Prove the Null Hypothesis of AGW?

This is not equivalent to running the model assuming zero warming comes from CO2.

Even if we stop emitting, completely, right now, the planet can continue to warm. Why? Because most things in nature are different than light switches, there's a concept of delay.

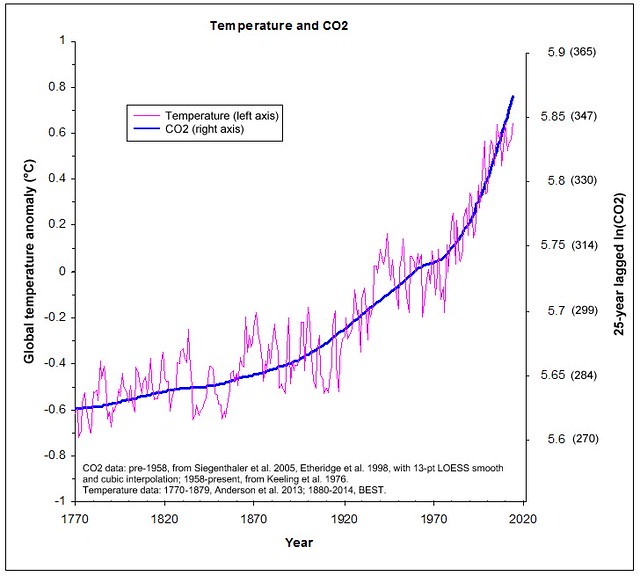
And yet the scenario posited by Hansen that assumes no more CO2 emissions is the one that most closely mirrors observed temperatures. That's more important than all the other details combined. Ball bears no responsibility whatsoever as to whether the planet would "continue to warm" under those circumstances. The model is, after all, Hansen's.

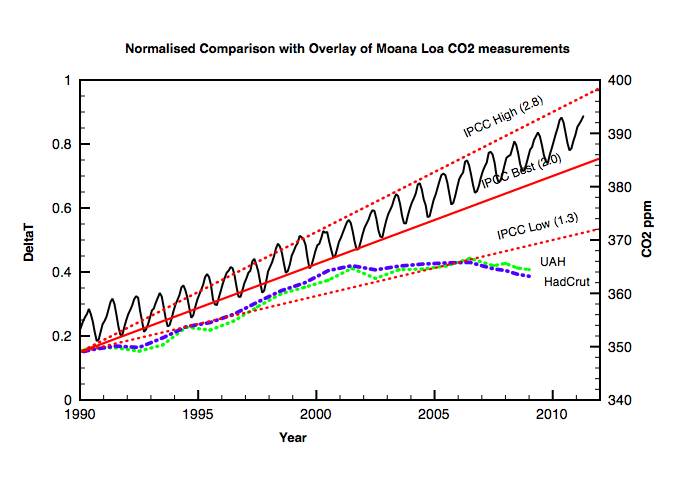
And here's some bonus data:

 
BREAKING NEWS!

Jack Hays says that climate sensitivity is 4.26°C per CO2 doubling! Near the UPPER END of the IPCC canonical range!

Climate Deniers everywhere weeping at having lost John Boehner, Kevin McCarthy, and Jack Hays in the same week!

The question on every lip remains: Will This Denier Deny that he is Denying Denial???

In a futile attempt to refute James Hansen, Jack Hays posted the following graph:

overlayco2.png

Observers note that the two vertical scales show 1°C (left side) exactly equal to the difference between 340 ppmv and 400 ppmv CO2 (right side). Obviously, this can only be true if the climate sensitivity is equal to ln(2)/{[ln(400)-ln(340)]/1} = 4.26°C per CO2 doubling. Thus, if climate sensitivity is in the middle of the IPCC range, the two lines should not even be expected to match!

We can show this graphically by choosing an empirically correct value for climate sensitivity. Instead of talking to the data, we will listen to it.

16721662898_39c842a8ec_z.jpg


Gee, by choosing the correct values for the two vertical scales, it all matches up just fine.

Amazing, the ways they can prevaricate in Denierstan.

Oh, and by the way: Roy "Fritz" Koerner's research showed that the Arctic had been on a long-term cooling trend for thousands of years prior to the industrial revolution. But I'm sure Jack will rush to tell us that his buddy had been co-opted by all the money being thrown around in climate science. When you talked to him, Jack, was he wearing a Rolex and driving a Lamborghini?
 
Last edited:
Then actaully comment on the science of it rather than just attacking the person behind the idea.

My point is that the science isn't being dealt with here, simply because no one in this thread is qualified to comment on it beyond a fairly limited extent. Timmy's reputation is imo very relevant.

>> Then you might get a little respect.

I'm not concerned about any respect I might get from you.
 
I already explained this, this is why having Ball, someone who lacks scientific credibility in this area, should not be referenced in place of the actual scientists own words-
Then you need to elaborate better, because I see no rational thought process from your explanations.
 
BREAKING NEWS!

Jack Hays says that climate sensitivity is 4.26°C per CO2 doubling! Near the UPPER END of the IPCC canonical range!

Climate Deniers everywhere weeping at having lost John Boehner, Kevin McCarthy, and Jack Hays in the same week!

The question on every lip remains: Will This Denier Deny that he is Denying Denial???

In a futile attempt to refute James Hansen, Jack Hays posted the following graph:


Observers note that the two vertical scales show 1°C (left side) exactly equal to the difference between 340 ppmv and 400 ppmv CO2 (right side). Obviously, this can only be true if the climate sensitivity is equal to ln(2)/{[ln(400)-ln(340)]/1} = 4.26°C per CO2 doubling. Thus, if climate sensitivity is in the middle of the IPCC range, the two lines should not even be expected to match!
LOL...

You don't know how to read charts.

LOL...

As it sits, it is showing quite clearly the keeling curve change between the 2.0 and 2.8 trend lines, which are the sensitivity numbers for a doubling of CO2. The graph is indication a sensitivity of about 2.4 degrees for the Keeling curve.

Your confirmation bias continues to blind you to the truth.

That 2.4 degrees for a doubling by the model should mean CO2 contributed about 0.37 degrees since 1990, if the chart is accurate.

However, the measured trend shown on the chart is around 0.2 degrees.
 
LOL...

You don't know how to read charts.

LOL...

As it sits, it is showing quite clearly the keeling curve change between the 2.0 and 2.8 trend lines, which are the sensitivity numbers for a doubling of CO2. The graph is indication a sensitivity of about 2.4 degrees for the Keeling curve.
And in what part of Denierstan is 2.0°C for CO2 doubling the "best" sensitvity that IPCC recommends? Citation please.

Ooops, I forgot! The denizens of Denierstan DON'T KNOW HOW TO READ when it comes to IPCC reports! LOL! LOL! LOL!

Don't know how to read ... that's a hot one! LOL!!

Or wait ... could it be that LoP simply misread the very same graph he castigates others for misreading? Could LoP have possibly just made a first-class fool out of himself?

Yes he could.
 
Last edited:
And in what part of Denierstan is 2.0°C for CO2 doubling the "best" sensitvity that IPCC recommends? Citation please.

Ooops, I forgot! The denizens of Denierstan DON'T KNOW HOW TO READ when it comes to IPCC reports! LOL! LOL! LOL!

Don't know how to read ... that's a hot one! LOL!!

Or wait ... could it be that LoP simply misread the very same graph he castigates others for misreading? Could LoP have possibly just made a first-class fool out of himself?

Yes he could.

I'm sorry you fail to comprehend.

The diagonal trend lines list the sensitivity to doubling. They are 1.3, 2.0, and 2.8 degrees.

You make the mistake of thinking I make claim these numbers are correct. I do not. I am pointing out that the graph indicates this.

Keep in mind that the left and right Y axis need not be proportionally scaled.
 
BREAKING NEWS!

Jack Hays says that climate sensitivity is 4.26°C per CO2 doubling! Near the UPPER END of the IPCC canonical range!

Climate Deniers everywhere weeping at having lost John Boehner, Kevin McCarthy, and Jack Hays in the same week!

The question on every lip remains: Will This Denier Deny that he is Denying Denial???

In a futile attempt to refute James Hansen, Jack Hays posted the following graph:


Observers note that the two vertical scales show 1°C (left side) exactly equal to the difference between 340 ppmv and 400 ppmv CO2 (right side). Obviously, this can only be true if the climate sensitivity is equal to ln(2)/{[ln(400)-ln(340)]/1} = 4.26°C per CO2 doubling. Thus, if climate sensitivity is in the middle of the IPCC range, the two lines should not even be expected to match!

We can show this graphically by choosing an empirically correct value for climate sensitivity. Instead of talking to the data, we will listen to it.

16721662898_39c842a8ec_z.jpg


Gee, by choosing the correct values for the two vertical scales, it all matches up just fine.

Amazing, the ways they can prevaricate in Denierstan.

Oh, and by the way: Roy "Fritz" Koerner's research showed that the Arctic had been on a long-term cooling trend for thousands of years prior to the industrial revolution. But I'm sure Jack will rush to tell us that his buddy had been co-opted by all the money being thrown around in climate science. When you talked to him, Jack, was he wearing a Rolex and driving a Lamborghini?

Shouting can't save a losing argument. I'm not trying to refute Hansen, I'm celebrating him for illustrating the null hypothesis. Please note how observed temperatures fall below even the IPCC low.
 
Shouting can't save a losing argument. I'm not trying to refute Hansen, I'm celebrating him for illustrating the null hypothesis. Please note how observed temperatures fall below even the IPCC low.

All the while failing to note (or even consider) that the emissions actually experienced during that same time were also far, far below the IPCC BAU scenario assumed.

Denier FAIL.
 
I'm sorry you fail to comprehend.

The diagonal trend lines list the sensitivity to doubling. They are 1.3, 2.0, and 2.8 degrees.

Totally and completely wrong. That's not what those numbers mean at all. You totally misunderstood the very graph you accused me of misunderstanding.

Denier FAIL.

You make the mistake of thinking I make claim these numbers are correct. I do not.

Not at all. It's you who are making the mistake of not understanding what you're looking at.

I am pointing out that the graph indicates this.
And I'm pointing out that the graph doesn't indicate that at all. You have completely misunderstood the graph. The same graph you accused me of misunderstanding.

Keep in mind that the left and right Y axis need not be proportionally scaled.

They do if you're trying to make a visual claim about CO2 and temperature. Because if they're not scaled proportionately, then the graph is misleading.

But hey, misleading is par for the course in Denierstan.
 
Back
Top Bottom