• This is a political forum that is non-biased/non-partisan and treats every person's position on topics equally. This debate forum is not aligned to any political party. In today's politics, many ideas are split between and even within all the political parties. Often we find ourselves agreeing on one platform but some topics break our mold. We are here to discuss them in a civil political debate. If this is your first visit to our political forums, be sure to check out the RULES. Registering for debate politics is necessary before posting. Register today to participate - it's free!

Capturing Global Warming in One Simple Statistic [W:1239:1469]

Re: Capturing Global Warming in One Simple Statistic

There are many ways to measure the world’s changing climate. You can chart rising global temperatures, rising sea levels and melting ice. What’s tougher, though, is to find a measurement that easily relates all of that to what people experience in their daily lives.

In a new study in Geophysical Research Letters, however, two Australian researchers do just this by examining a simple but telling meteorological metric — the ratio of new hot temperature records set in the country to new cold temperature records.

The study found that from 1910 to 1960, the ratio of hot to cold records was close to 1 to 1. From 1960 to 2014, however, that changed, as hot records started to happen much more frequently than cold records — and from 2000 to 2014, outnumbered them by more than 12 to 1.

The simple statistic that perfectly captures what climate change means - The Washington Post

Actually, the simple statistic that perfectly captures what climate change means is this: The West has more money, how can we get it fast?

After everything is said and done, apparently money will cure Climate Change. Money as in transfers of wealth on historical scale to other countries.

For example, the latest "statistics" from the AGW brain trust:

http://www.nature.com/nclimate/journal/vaop/ncurrent/full/nclimate2774.html

​The US Owes the World $4 Trillion for Trashing the Climate | Motherboard

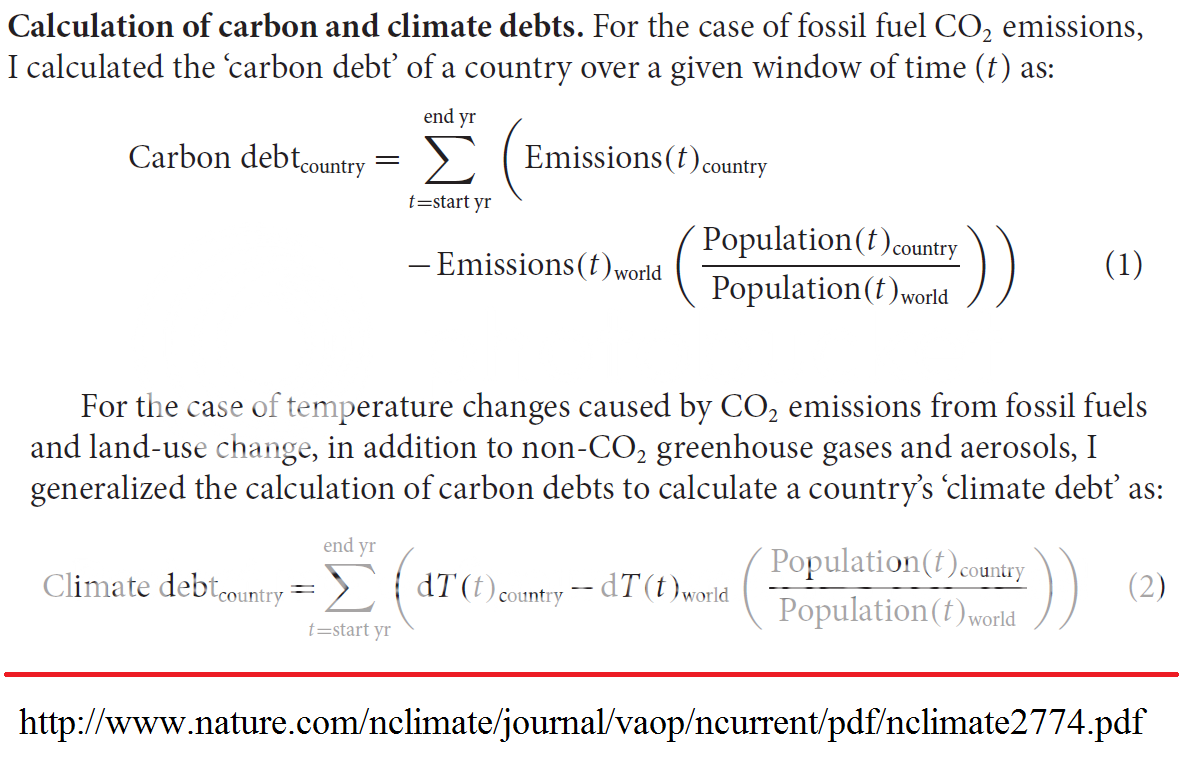
That, in super-basic terms, is the concept of climate debt, which guides current emissions negotiations and efforts to distribute funds for adaptation to nations most affected by climate change. If you acknowledge, as the UN does, that there’s a carbon budget—an amount of greenhouse gas pollution the world can collectively churn out before we land in dangerous warming territory, currently figured at a 2˚C threshold—then it follows that nations that have overstepped theirs should pay back those who haven’t.

But it’s a good way to envision the scale of the climate damage done by industrial nations, mostly the US, compared to the vast majority of countries coping with warming around the globe. Even China, “the world’s factory,” has nothing on the US’s past penchant for whipping up carbon pollution. That's good to remember, as many continue to point to the developing world as a source of rampant pollution: The US is the historic cause of this problem, and has done very little to make amends for it.​

So for those who attend regular Mass at the Church of AGW, get honest, it isn't the science, it's the money. Undeniable.
 
Re: Capturing Global Warming in One Simple Statistic

No the disagreement is between those who understand science and religious idios who wish to have us all panic so that they can impose their communist agenda.

Oh yes, the people who understand the science. Who are these people? Not climate scientists? Nope. They are people who are not educated in the field, do not work in the field, but lurk on forums telling everyone they know the real truth, the real science. They know how it really works. :lamo

Funny you say those who listen to the scientists are "religious idios (idiots? do you use ancient Greek words intentionally?)" who are also at the same time part of a manipulative plot to enforce communism. Wow so are we idiots (devoted to our religion of warmism? lol) or ideological conspirators part of a secret network of propaganda? :lamo
 
Last edited:
Re: Capturing Global Warming in One Simple Statistic


global warming propaganda video made by Al Gore^

10 years later, i still live in Florida, and the beach is in the same place it was when i first went there with my family 25 years ago.


Ya, I remember that, the great flood of 2013... Washed away all coastal cities the world over.
 
Re: Capturing Global Warming in One Simple Statistic


global warming propaganda video made by Al Gore^

10 years later, i still live in Florida, and the beach is in the same place it was when i first went there with my family 25 years ago.


What I find laughable, is there are three different releases of that shockumentary. I had the first release, loaned it out, forgot ho had it, and never got it back. It has scenes that were later cut out, for obvious reasons. I have ordered copies trying to find the original one again, so I can prove he said certain things that are edited out. Plus... there was an opening scene of a flowing glacier, covered with soot!

Gore... the man who is the former next president, and invented the internet, is one unethical, egotistic, arrogant, ignorant ass.
 
Re: Capturing Global Warming in One Simple Statistic


LOL...

Calculation of carbon and climate debts.

I don't agree with carbon debts, but here is something for those of you interested:

NClimate2774%20formulas_zpsuxdkemo7.png
 
Re: Capturing Global Warming in One Simple Statistic

The Pause lengthens yet again

A new record Pause length: no warming for 18 years 8 months By Christopher Monckton of Brenchley One-third of Man’s entire influence on climate since the Industrial Revolution has occurred since January 1997. Yet for 224 months since then there has been no global warming at all (Fig. 1). With this month’s RSS temperature record,…

 
Re: Capturing Global Warming in One Simple Statistic

No, but there is a consensus regarding the science. You just refuse to acknowledge the science and the consensus.

No, I embrace the actual science.
 
Re: Capturing Global Warming in One Simple Statistic

Thanks for proving my point.

Wow...

You think you proved a point?

I'm at a loss for words, without getting an infraction.
 
Re: Capturing Global Warming in One Simple Statistic

The disagreement is between greedy people who only care about themselves versus people who would rather minimally defile Earth's ecosystems for future generations.

That's odd, you and your ilk don't seem concerned with saddling future generations with trillions upon trillions of dollars of debt. I guess concern for future generations is limited to ideological viewpoints. :shrug:
 
Re: Capturing Global Warming in One Simple Statistic

That's odd, you and your ilk don't seem concerned with saddling future generations with trillions upon trillions of dollars of debt. I guess concern for future generations is limited to ideological viewpoints. :shrug:

Actually I am. Where do you think we could get the money to pay off the debt?

actual-wealth-distribution.jpg


Here's a better graphic, the top 1% is actually cut off in that one.

wealth-distribution-630x315.jpg
 
Re: Capturing Global Warming in One Simple Statistic

No, I embrace the actual science.

The science that the scientists say means one thing and you say means another because you read it and determined the scientists are wrong about their own papers.
 
Re: Capturing Global Warming in One Simple Statistic

Wow...

You think you proved a point?

I'm at a loss for words, without getting an infraction.

According to you, nobody says it's not warming. But then YOU say it's not warming. That's a point. But I understand completely why you're at a loss for words.
 
Re: Capturing Global Warming in One Simple Statistic

According to you, nobody says it's not warming. But then YOU say it's not warming. That's a point. But I understand completely why you're at a loss for words.

Words have meaning, which you clearly don't understand.
 
Re: Capturing Global Warming in One Simple Statistic

There has been no "significant" warming over the last 17 years. The slope is almost flat. The numbers cited are so small, they are well within error margins, and there is at least one data record that shows cooling.

Certainly nothing on which to base significantly impactful economic decision on.
 
Re: Capturing Global Warming in One Simple Statistic


Indeed.

The long and model-unpredicted Great Pause of 18 years 8 months in global mean lower-troposphere temperature as recorded in the RSS satellite monthly dataset is inexorably driving down the longer-run warming rate, when the IPCC’s predictions would have led us to expect an acceleration.

The graph shows the entire RSS lower-troposphere satellite dataset for the 440 months January 1979 to August 2015, with the bright blue trend on the entire series equivalent to just over 1.2 C°/century. Overlaid graph in green is the zero trend in the 224 months since January 1997 – more than half the entire 440-month record.
RSS anomalies (K/century equivalent), Jan 1979 to Dec of the year shown
19900.5019991.4520081.41
19910.8920001.3720091.36
19920.3320011.4620101.46
19930.1220021.5720111.36
19940.2920031.6620121.29
19950.6620041.6120131.24
19960.7120051.6620141.21
19970.8220061.6120151.21
19981.5320071.58
As one would expect, the point (2007-8) where the long-run trend-line intersects the Pause trend-line is the moment from which the Pause begins to reduce the long-run trend. As the table shows, the trend had been below 1 K/century till the Great El Niño of 1998 lifted it suddenly above 1.5 K/century. It remained there till 2008, since when it has been dropping gently. From January 1979 to August 2015, the trend was just 1.21 K/century.
In 1990, the IPCC had predicted near-straight-line warming of 1 K to 2025, equivalent to almost 2.8 K/century. Of this warming, more than 0.7 K should have happened by now, but only 0.26 K has actually occurred. The IPCC’s central estimate in 1990, though made on the basis of “substantial confidence” that the models on which it relied had captured all the essential features of the climate system, has proven – thus far, at any rate – to be a near-threefold exaggeration.
In the run-up to the Paris world government conference, the climate Communists are making determined efforts to pretend that the Pause does not exist, or that the rate of warming since 1990 is exactly as the IPCC had predicted. Both pretenses are false. The UAH and RSS satellite data both show the Pause, though the terrestrial tamperature datasets have all been altered in the past year with the effect of concealing it.
Furthermore, the warming rate is now embarrassingly far below prediction. It is worth demonstrating this fact with the IPCC’s own graphs:
 
Re: Capturing Global Warming in One Simple Statistic

There has been no "significant" warming over the last 17 years. The slope is almost flat. The numbers cited are so small, they are well within error margins, and there is at least one data record that shows cooling.

That is so preposterously false (and shown to be so many times) that continuing to claim that speaks for itself of the ideological extremism that clings to that false statement. The determination to ignore truth and fact can only be explained by a zealous determination to ignore facts no matter how solid or how often they're presented.
 
Re: Capturing Global Warming in One Simple Statistic

Indeed.

The long and model-unpredicted Great Pause of 18 years 8 months in global mean lower-troposphere temperature as recorded in the RSS satellite monthly dataset is inexorably driving down the longer-run warming rate, when the IPCC’s predictions would have led us to expect an acceleration.

The graph shows the entire RSS lower-troposphere satellite dataset for the 440 months January 1979 to August 2015, with the bright blue trend on the entire series equivalent to just over 1.2 C°/century. Overlaid graph in green is the zero trend in the 224 months since January 1997 – more than half the entire 440-month record.
RSS anomalies (K/century equivalent), Jan 1979 to Dec of the year shown
19900.5019991.4520081.41
19910.8920001.3720091.36
19920.3320011.4620101.46
19930.1220021.5720111.36
19940.2920031.6620121.29
19950.6620041.6120131.24
19960.7120051.6620141.21
19970.8220061.6120151.21
19981.5320071.58
As one would expect, the point (2007-8) where the long-run trend-line intersects the Pause trend-line is the moment from which the Pause begins to reduce the long-run trend. As the table shows, the trend had been below 1 K/century till the Great El Niño of 1998 lifted it suddenly above 1.5 K/century. It remained there till 2008, since when it has been dropping gently. From January 1979 to August 2015, the trend was just 1.21 K/century.
In 1990, the IPCC had predicted near-straight-line warming of 1 K to 2025, equivalent to almost 2.8 K/century. Of this warming, more than 0.7 K should have happened by now, but only 0.26 K has actually occurred. The IPCC’s central estimate in 1990, though made on the basis of “substantial confidence” that the models on which it relied had captured all the essential features of the climate system, has proven – thus far, at any rate – to be a near-threefold exaggeration.
In the run-up to the Paris world government conference, the climate Communists are making determined efforts to pretend that the Pause does not exist, or that the rate of warming since 1990 is exactly as the IPCC had predicted. Both pretenses are false. The UAH and RSS satellite data both show the Pause, though the terrestrial tamperature datasets have all been altered in the past year with the effect of concealing it.
Furthermore, the warming rate is now embarrassingly far below prediction. It is worth demonstrating this fact with the IPCC’s own graphs:

Now you've gone from the ridiculously absurd to the hilariously ridiculous absurd, Jack. Someone just adding a downward green line to a graph showing a continually upward trending mean isn't going to fool anyone but the fools. I'm actually surprised you thought you could pass that off (here I'm giving you the benefit of assuming you must have known how patently stupid that line was). The other graph you put up is just a denialist invention based on what appears to be a dog's breakfast of data all put into one graph with no explanatory data (e.g., the date of the IPCC data--there have been multiple IPCC reports; and that thick black line is also just funny to see since it's obviously come from some other source and just got pasted over the other chart, probably by someone with a steady hand and a couple markers). This looks like the kind of "science report" that an 8th grader might submit (except that even an 8th grader would probably known that he needed to put his sources in the report). Jack, I'd have thought even you would have had the necessary minimum of self-respect to stop humiliating yourself by now.
 
Last edited:
Re: Capturing Global Warming in One Simple Statistic

Now you've gone from the ridiculously absurd to the hilariously ridiculous absurd, Jack. Someone just adding a downward green line to a graph showing a continually upward trending mean isn't going to fool anyone but the fools. I'm actually surprised you thought you could pass that off (here I'm giving you the benefit of assuming you must have known how patently stupid that line was). The other graph you put up is just a denialist invention based on what appears to be a dog's breakfast of data all put into one graph with no explanatory data (e.g., the date of the IPCC data--there have been multiple IPCC reports; and that thick black line is also just funny to see since it's obviously come from some other source and just got pasted over the other chart, probably by someone with a steady hand and a couple markers). This looks like the kind of "science report" that an 8th grader might submit (except that even an 8th grader would probably known that he needed to put his sources in the report). Jack, I'd have thought even you would have had the necessary minimum of self-respect to stop humiliating yourself by now.

And again resorting to insults when trumped by the data. No one respects that.
 
Re: Capturing Global Warming in One Simple Statistic

I don't think anyone here disagrees that global warming has happened.

The disagreement is about how much is natural, and how much cause by mankind.

I'll put $20 that you didnt think this twenty years ago. Or maybe 15 years ago. You only changed your mind because after a while, you realized it was too embarrassing not to. Its because your political Randian bent is stronger than your logical/common sense bent.

Now its 'yes, its happening, but gosh - its might be natural based upon whatever crap I can pretend to believe in today (I think its sunspots this year)'.

Eventually, you'll transform into a lukewarmer - yes, man is doing it and yes it will be warm - but its a good thing and the good will outweigh the bad.

Then, as it becomes obvious that none of this is true, you'll insist you always knew AGW was real. But you'll probably be dead by then, so your conscience will be clear.
 
Re: Capturing Global Warming in One Simple Statistic

I'll put $20 that you didnt think this twenty years ago. Or maybe 15 years ago. You only changed your mind because after a while, you realized it was too embarrassing not to. Its because your political Randian bent is stronger than your logical/common sense bent.

Now its 'yes, its happening, but gosh - its might be natural based upon whatever crap I can pretend to believe in today (I think its sunspots this year)'.

Eventually, you'll transform into a lukewarmer - yes, man is doing it and yes it will be warm - but its a good thing and the good will outweigh the bad.

Then, as it becomes obvious that none of this is true, you'll insist you always knew AGW was real. But you'll probably be dead by then, so your conscience will be clear.

If you keep your head under the covers until sunrise then the monsters will have gone away.:bright:
 
Re: Capturing Global Warming in One Simple Statistic

And again resorting to insults when trumped by the data. No one respects that.

Jack, Jack, Jack....those are faked graphs. I'm not saying you faked them yourself but the CAGW lie funnel you depend on certain found a source for you to disseminate to try to prop up your pathetic anti-science crusade. You're being duped, Jack, but you're a will and eager one.
 
Re: Capturing Global Warming in One Simple Statistic


Did you see the temperature trend graph Jack pasted up below where someone just drew in a downward slope free hand without the slightest regard for the actual means as "proof" that there's been a cooling trend. The grade-school level of the fakery would be funny if it weren't such a serious matter.
 
Back
Top Bottom