- Joined
- Mar 16, 2009
- Messages
- 47,477
- Reaction score
- 53,180
- Location
- Dixie
- Gender
- Male
- Political Leaning
- Independent
What's really warming the world?
Well, to be honest, it's me arse.
Sorry about that. I do like me some baked beans though...

What's really warming the world?
As Shaviv notes, during the 20th century solar activity reduced cosmic ray influence, triggering warming. Your source seems not to have grasped that aspect of the work.
And solar forcing has reduced over the last century, which should have triggered cooling. By every known natural forcing mechanism, we should be in a cooling trend, not a warming trend. The only way the current warming trend has been explained is through anthropogenic means.
Wrong. The sun was quite active in the 20th century.


Take from this what you will, but Bloomberg has a cool interactive graphic on what is causing our climate to warm:
What's Really Warming the World? Climate deniers blame natural factors; NASA data proves otherwise
Silly me.Well, to be honest, it's me arse.
Sorry about that. I do like me some baked beans though...
Not true.And solar forcing has reduced over the last century, which should have triggered cooling. By every known natural forcing mechanism, we should be in a cooling trend, not a warming trend. The only way the current warming trend has been explained is through anthropogenic means.
Not true.
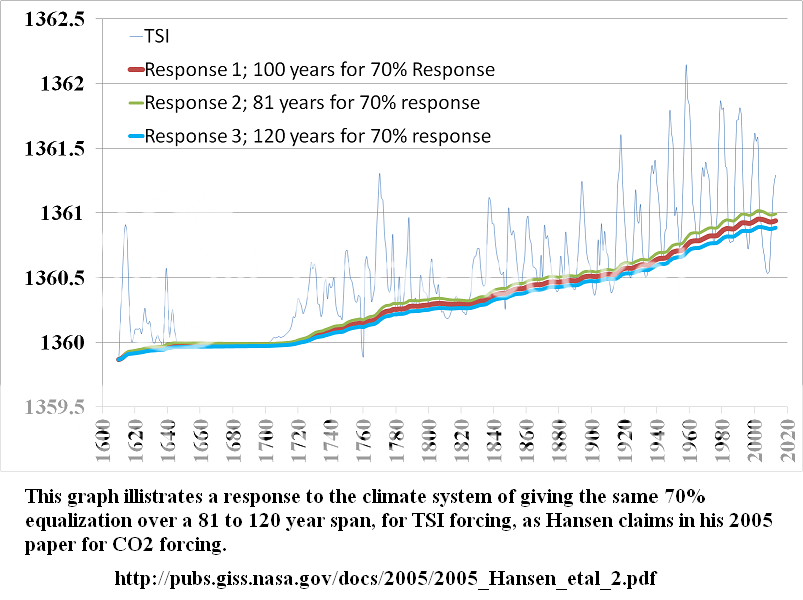
If you are speaking of 1900 to 2000, then the TSI changed from 1360.8 to 1361.3 W/m^2 using an 11 year running average and using the data accepted from the site using SORCE and it's accepted reconstruction. It's 1360.5 and 1361.6 for 1900 and 2000.
http://lasp.colorado.edu/home/sorce/files/2011/09/TSI_TIM_Reconstruction.txt
I would like to see your information that show a decline.
Link please.
Really? We are right now at some of the lowest levels on record, yet we are still quite warm:
In recent years temperatures and solar irradiance has diverged by quite a lot:
View attachment 67186475
Well, to be honest, it's me arse.
Sorry about that. I do like me some baked beans though...
Really? We are right now at some of the lowest levels on record, yet we are still quite warm:
In recent years temperatures and solar irradiance has diverged by quite a lot:
View attachment 67186475
Take from this what you will, but Bloomberg has a cool interactive graphic on what is causing our climate to warm:
What's Really Warming the World? Climate deniers blame natural factors; NASA data proves otherwise

Yes indeed. And as solar activity subsided in the 21st century we have The Pause.
Recent paper finds 1950-2009 Solar Grand Maximum was a ‘rare or even unique event’ in 3,000 years
Sun said to be “bi-modal” While many, including the IPCC, suggest the modern Grand Maximum of solar activity from 1950-2009 has nothing to do with the 0.4C global warming measured over that time frame, it does seem to be unique in the last three millennia. from CO2 Science: A 3,000-Year Record of Solar Activity What…
August 6, 2014 in Climate News, Solar. Chinese study ‘implies that the “modern maximum” of solar activity agrees well with the recent global warming’
From Science China Press [h/t to Mark Sellers] Has solar activity influence on the Earth’s global warming? A recent study demonstrates the existence of significant resonance cycles and high correlations between solar activity and the Earth’s averaged surface temperature during centuries. This provides a new clue to reveal the phenomenon of global warming in recent…
June 5, 2014 in Global warming, Solar. Paper demonstrates solar activity was at a grand maximum in the late 20th century
Solar activity measured by isotope proxies revealed the end of 20th century was the highest activity in 1200 years A 2010 paper (that I somehow missed) was recently highlighted by the blog The Hockey Schtick and I thought it worth mentioning here even if a bit past the publish date. The work by Ilya G.…
Except temperatures did not pause. We had our warmest year globally on record last year and this year we are on track to blow all previous years out of the water.
2014 Officially Hottest Year on Record - Scientific American
2015 Hottest Year to Date, Could Top 2014 Record | Climate Central
This is despite a reduction in solar forcing. The extent to which deniers will ignore basic thermal physics in regards to CO2 PPM and human land use changes is astounding. By the way, wattsupwiththat is quoting trash journals like CO2 Science. Due to open access (which is a good thing in and of itself), there have been numerous trash journals out there that have popped up where you can pay to publish virtually anything you want (for example when journalists published a garbage study that showed eating chocolate caused you to lose weight).

Since you're so eager to change the subject I'll have to conclude you are conceding the point on solar activity. As for The Pause, it's unfortunate for you that you can't wish it away.
El Niño strengthens: the Pause lengthens
Global temperature update: no warming for 18 years 6 months By Christopher Monckton of Brenchley For 222 months, since December 1996, there has been no global warming at all (Fig. 1). This month’s RSS temperature – still unaffected by a slowly strengthening el Niño, which will eventually cause temporary warming – passes another six-month milestone,…
I haven't conceded the solar activity argument. We are clearly in a period of reduced solar activity and you are cherry picking one single data set that is an outlier among many to argue that we are not warming. At this point its obvious we are not going to agree.
At any rate, using RSS is misleading because it is indeed an outlier. The problem with the RSS satellites is they are older and unable to maintain stable orbits and thus becoming more and more unreliable and thus their diverge from UAH measurements in recent years. Explanation is here: Seeing the environmental forest: What is the deal with RSS?
The fact is we are not going to agree. However there is a reason why the vast majority of the scientific community agrees with my position while a small minority agrees with your position and its not some conspiracy.
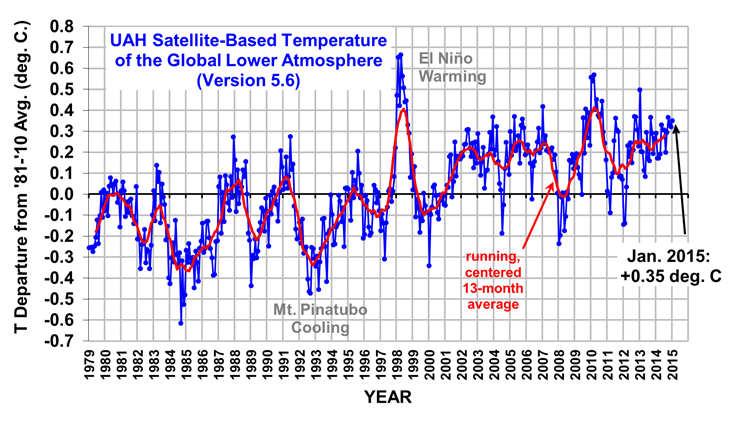
RSS is a perfectly fine dataset. But if you want UAH, you get UAH.
UAH Lower Atmosphere Temperature Anomalies – 1979 to Present

Unless you pick the one outlier year of 1998 as a starting point, if you draw a trend line on that graph, you will find there is no pause to our climatic warming (but rather a reduction in the rate of warming from about 2000 through 2010 or so). Moreover, if you introduced confidence variability (its 95%) then its very hard to discern any kind of trend other than a generalized warming one.
Why do you discount surface temperature measurements entirely? It is not like satellite measurements don't have to extrapolate a lot of measurements as well. They don't have universal coverage and will be biased to the areas covered by their stationary orbits just like temperature measurements are biased to where we have greater coverage of surface measurement stations.
Which is why The Pause dates from just before 1998. Satellites vs ground stations? I trust satellites more.
Well there is your problem, you trust satellites more. To quote Roy Spencer:
"One might ask, Why do the satellite data have to be adjusted at all? If we had satellite instruments that (1) had rock-stable calibration, (2) lasted for many decades without any channel failures, and (3) were carried on satellites whose orbits did not change over time, then the satellite data could be processed without adjustment. But none of these things are true. Since 1979 we have had 15 satellites that lasted various lengths of time, having slightly different calibration (requiring intercalibration between satellites), some of which drifted in their calibration, slightly different channel frequencies (and thus weighting functions), and generally on satellite platforms whose orbits drift and thus observe at somewhat different local times of day in different years. All data adjustments required to correct for these changes involve decisions regarding methodology, and different methodologies will lead to somewhat different results. This is the unavoidable situation when dealing with less than perfect data."
Version 6.0 of the UAH Temperature Dataset Released: New LT Trend = +0.11 C/decade « Roy Spencer, PhD
Nice try. Also Spencer:
In my opinion, though, a bigger problem than the spotty sampling of the thermometer data is the endless adjustment game applied to the thermometer data. The thermometer network is made up of a patchwork of non-research quality instruments that were never made to monitor long-term temperature changes to tenths or hundredths of a degree, and the huge data voids around the world are either ignored or in-filled with fictitious data.
Furthermore, land-based thermometers are placed where people live, and people build stuff, often replacing cooling vegetation with manmade structures that cause an artificial warming (urban heat island, UHI) effect right around the thermometer. The data adjustment processes in place cannot reliably remove the UHI effect because it can’t be distinguished from real global warming.
Satellite microwave radiometers, however, are equipped with laboratory-calibrated platinum resistance thermometers, which have demonstrated stability to thousandths of a degree over many years, and which are used to continuously calibrate the satellite instruments once every 8 seconds. The satellite measurements still have residual calibration effects that must be adjusted for, but these are usually on the order of hundredths of a degree, rather than tenths or whole degrees in the case of ground-based thermometers.
And once again, why do so few of his peers agree with him? Possibly because rural temperature stations show the same trends as urban ones:
How convenient you forget there is only something like a 38% chance it was the warmest, and that's with all the stretching of data the alarmists can do..Except temperatures did not pause. We had our warmest year globally on record last year and this year we are on track to blow all previous years out of the water.
I trust long standing land sites more that have not been corrected or within a mile of urban growth. Satellites have a problem seeing through the layers accurately. I also trust the old mercury thermometers better than remote semiconductor probes.Which is why The Pause dates from just before 1998. Satellites vs ground stations? I trust satellites more.