The stuff about cosmic radiation variation over 500 million years is interesting. The theory suggests that changes in marine biodiversity over the period can be correlated with two main factors: Changes in ocean depth - and hence the extent and range of continental shelf habitats available for exploitation - and changes in incoming cosmic radiation as deduced from the proximity of star clusters with supernovae. However in the paper referenced Svensmark himself notes that an influence on biodiversity caused by varying cosmic radiation from nearby supernovae need not be due to climatic changes:
The connection with SN rates revealed in Fig. 20 adds to the mix of hypotheses, by providing strong evidence that Galactic cosmic rays (GCR) have influenced the course of evolution. Since H.J. Muller in the 1920s showed that ionizing radiation causes genetic mutations (Muller 1927), an obvious contribution of GCR to evolution has been well known - namely in provoking some of the mutations on which natural selection works. The importance of GCR in this respect remains uncertain because other causes of mutagenesis include solar protons, radioactivity, environmental chemicals, thermal shock and transcription errors. Natural repair mechanisms that organisms possess may be better adapted to continuous hazards like GCR than to rare events like thermal shock.
On the other hand, GCR seem to exert a strong though indirect evolutionary influence by varying the climate. A persistently warm climate tends to reduce global biodiversity, because there is little motivation to evolve, dominant species keep others in check, and there is less variety in habitats and living conditions between the tropics and the polar regions. In a cold and variable climate, on the other hand, the dominant species are stressed and this gives opportunities to other species, in accordance with the intermediate disturbance hypothesis that traces back to Grime (1973). Cold conditions also provide a greater variety of habitats and living conditions.
Svensmark 2012, Evidence of nearby supernovae affecting life on Earth; Monthly Notices of the Royal Astronomical Society
In other words whilst acknowledging both the environmental variations associated with changing sea levels and the probable mutagenic influence of cosmic radiation variation, his theory seeks to emphasise
a second kind of environmental variation instead. But it looks like he offers nothing but speculation for downplaying the mutagenic role.
Furthermore, the suggestion that cosmic radiation variations directly caused the climate shifts discussed seems questionable. Once again, Svensmark himself suggests a correlation between supernova rates and both climate
and CO2:
As glacial versus warm conditions seem to follow SN rates (Figs. 17 and 18) one can look for matches between CO2, 13C and SN rates. In the case of CO2, data are sparse in the earlier part of the 500-Myr record considered here, but more abundant later. In Fig. 21 the proxies for CO2 are paleosols (fossil soils) which offer the longest time-span although less accurate at low CO2 (Royer et al. 2001) and fossil planktonic foraminifera organisms from the oceans (Royer 2006). The CO2 scale is inverted because because high SN rates (cold climate) and low CO2 go together, and the logarithm of the CO2 concentrations is used, on the assumption that the relation is not linear, in particular when the when CO2 is scarce. The match between CO2 and SN rates encourages further pursuit of the hypothesis in respect of δ13C, as a possible indicator of primary productivity.
He suggests that the variations in CO2 may be caused by biological cycles due to the relative abundance of life. But from a (very brief) glance he does not seem to address the possibility that the climate variations may (partly or largely) have been a
consequence of changing CO2 levels. See for example
Royer et al 2004, CO2 as a primary driver of Phanerozoic climate; GSA Today (Geological Society of America)
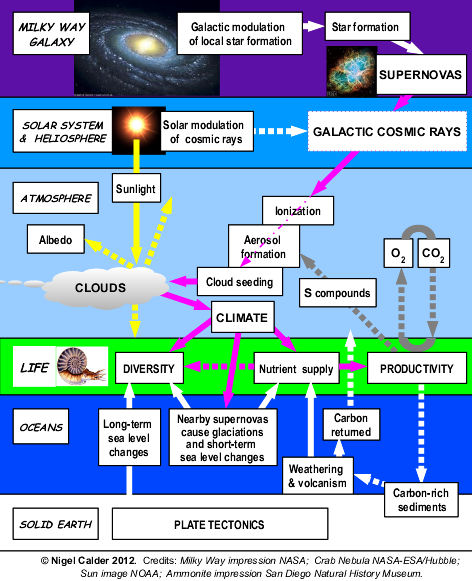
In short Svensmark proposes the sequence
GCR change -> Cloud cover change -> Climate change -> Diversity/abundance change -> CO2 change
while a different sequence
GCR change -> Mutation change -> Diversity/abundance change -> CO2 change -> Climate change
seems like a plausible alternative, to amateur eyes at least.
On that point it's worth noting that whether or not cosmic radiation has
some influence on cloud nuclei, I'm still not seeing any persuasive case for a clear long-term correlation with global cloud cover, and especially not with modern observed temperature trends. On the contrary, the recent GCR-variation graph which Calder provides on that page ("from a 2007 report by Svensmark and the Institute’s director, Eigil Friis-Christensen") extends the
non-correspondance between GCR and temperature back 50 years! It implies that GCR had made essentially no net contribution to global warming between 1960 and 1990, or between 1970 and 2000/2005. A vague correlation emerges only once the warming trend is removed;
in Calder's words:
In the upper panel the temperatures roughly follow the solar cycle. The match is much better when well-known effects of other natural disturbances (El Niño, North Atlantic Oscillation, big volcanoes) are removed, together with an upward trend of 0.14 deg. C per decade. The trend may be partly due to man-made greenhouse gases, but the magnitude of their contribution is debatable.
If the correlation between GCR and mid/long-term climate trends exists only once the mid/long-term climate trends are removed, where does that leave the theory?

 eace
eace