• This is a political forum that is non-biased/non-partisan and treats every person's position on topics equally. This debate forum is not aligned to any political party. In today's politics, many ideas are split between and even within all the political parties. Often we find ourselves agreeing on one platform but some topics break our mold. We are here to discuss them in a civil political debate. If this is your first visit to our political forums, be sure to check out the RULES. Registering for debate politics is necessary before posting. Register today to participate - it's free!

Why do we measure inflation in dollars, instead of in hours of labor?

Is there a published metric for units of production purchased by a specific unit of labor? I mean is that like a "thing"?

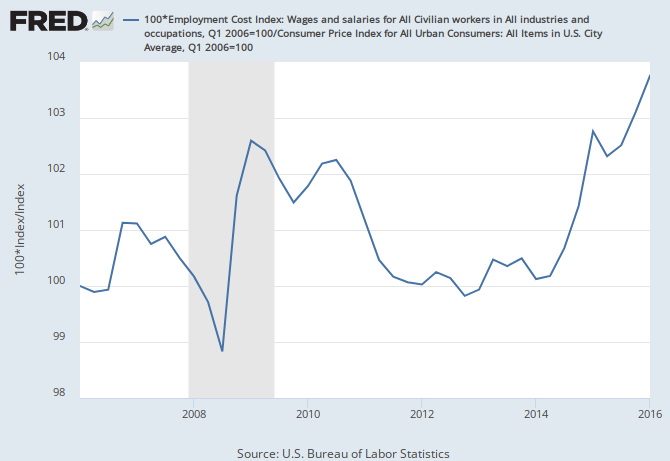
I brought this up in a earlier thread, and the idea was pretty much poo pooed, but the purchasing power of the median labor hour seems to be a much better metric than inflation for measuring our economic health. Is there a name for this? If not, can I claim the concept as my very own and get an award or something?

Anyone got a suggestion on what I should name this concept? Maybe PPPMWH (Purchasing Power Per Median Work Hour). Or 3PH for short? How about 3CPO, no, that conjures up images of a gold tin man.

Perhaps one way to go about this discussion is talk about what various economic indicators tell us, and why there is weight given to some economic indicators that perhaps grab more headlines than others that do not generate near the same degree of debate.

The issue at hand is what inflation as measured by the Consumer Price Index (CPI) or Personal Consumption Expenditures price index (PCE) really tells us *and* who is impacted. Without derailing the conversation too much on the difference in these measures or why the Fed prefers one over the other, the ultimate goal is to tell us in economics discussions what the typical basket of goods and services that we all buy cost on a trend line. The reason that is important is because by theory no one is immune from the impacts of inflation when measured on what we typically buy. As a key economic indicator it gives us some idea what the "cost of living" is when defining these basic goods and services. A secondary reason why it is important is in line with other key economic indicators it tells us the health of inflation when matched against income and wages, or matched against unemployment, or matched against currency strength, or matched against GDP all also on a trend line.

One thing we should dismiss is the idea that one economic indicator tells us the whole story about the status (or health) of an economy.

What you are asking for in "median labor hour" is something we already have in terms of what it tells us on the status of the workforce. Median household income on a tend line (for example) gives us a point of reference on the standard of living and distribution of income in an economic model. Because "median" anything gives us two halves to evaluate. A similar story is dealing with mean household income on a trend line as that gives us averages to evaluate the same thing (standard of living and distribution of income.) On that level we can dig deeper into various income quintiles and know how various demographics operate in the economic model.

The main reason why there is not much effort to blend into a single stat purchasing power (presumably using inflation measure) by the median labor hour (your term) is it clouds what these indicators tell us as they stand today.

When economists, the Fed, or the government, or whoever else look at these key economic indicators the whole idea of having so many is to identify economic fault. For instance, if inflation suddenly takes off but all other economic indicators (like unemployment, or GDP, or median household income) stay mostly flat that is something to evaluate. It is monetary policy, is it the dollar index, is it some problem with production or imports? We have a basis to evaluate why one stat becomes out of sync with others. Blending all of these things into various single stats may remove certain economic disparities we need to know about with all of these separate reports.

Let me close by saying the whole purpose of economics as an academia is to observe function and behavior. Inflation measures tend to upset people as some look at it as "unregulated taxation" or "theft of income," but those groups tend to ignore all the other economic indicators when doing so. Worse, they tend to ignore what the economics of the matter tells us about the difference between healthy and unhealthy inflation. All the numbers go into that evaluation and show us why we want a 2% inflation.

When engaging in looking at one number without any context, you get ... :scared:
 
I found a metric called Employment Cost Index, which might be a substitute for hourly wage compensation. Here's what I did:

View attachment 67201291

Data is the quotient of CPIAUCSL (annual average, index 1982-1984 = 100) and Employment Cost Index (Service Occupations, December Indices, Index Dec 2005 = 100); quotient is re-indexed at 1980 = 1.00.

Consumer Price Index (CPI)
http://www.bls.gov/ncs/ect/sp/ecconst.pdf


If this methodology is sound enough for a rough look, then it looks like the libertarians were generally right--inflation was stronger than wage growth from 1980 to 1984 (not surprising), but held generally level between 1984 to 1996, and then started plummeting again in 1996 (Clinton. Go figure).

Awsome!!!!!!!!!!!

That's exactly what I'm talking about.

And it does make for an interesting graph that indisputably proves that at least the Service Occupations that you used aren't doing well at all.
 
No singular measure is sufficient to assess the economic health of a nation. Inflation is commonly short term for price inflation but could actually refer to a number of different measures, one of which is wage inflation as it happens. Clearly to assess the internal health of an economy you’d need to consider prices and income, and the in the inevitably varied ranges and extremes rather than singular national averages.

The kind of measure you’re thinking of has difficulties because it’s based on multiple hugely varying measures (wages, prices, employment, non-wage income etc.) so even if you could establish a way of boiling all that down to a standard measure, you wouldn’t be able to read anything at all in to it changing without further details. There’s no benefit in making those calculations when you’d need to look at the individual measures that would be combined in to it anyway.

I'm not really looking to boil everything down to a single measure, just one that people who have no understanding of math can easily understand. A measure of our purchasing power based upon how much stuff an hour of labor would purchase.

I think the value in this would be to be able to easily point out to people that although we have inflation, it's not really the amount of inflation that makes a difference in our lives, it's how much money we make that makes a difference, so if we have 5% inflation and 5% wage growth, we are net zero in purchasing power, not -5%.

I have a lot of friends who constantly stop around complaining that inflation is ruining their lifestyle. I'd just like to be able to easily point out that maybe it isn't as bad as they think it is.
 
Then again, maybe the measure shouldn't be a ratio at all, because the way you're looking at it may be more appropriate to call it the difference between inflation and wage growth.

pppmwh wage growth minus inflation.png

Your images aren't displaying. Anyhow, I think that a ratio would be easy to understand more so than the difference, although we could uses a difference (like an hour of labor has has gained or lost X% of purchasing power over Y period of time).
 
couldn't you just use median income adjusted for inflation?

Yea, thats pretty much what I am talking about. The unemployment rate and the inflation rate make headlines in the media, but if we want to know what our median income adjusted for inflation is, then we have to dig for that. Maybe the name is just too long, and we could use something like Purchasing Power Rate

How much stuff we can purchase is all most people really care about anyhow.
 
...

The main reason why there is not much effort to blend into a single stat purchasing power (presumably using inflation measure) by the median labor hour (your term) is it clouds what these indicators tell us as they stand today....
When engaging in looking at one number without any context, you get ... :scared:

I'm just wondering if the reporting of the inflation rate doesn't cloud the minds of the general public. Not really talking about economists who need to look at a broad array of data, but just the average Joe on the street. They see the inflation rate reported, but fail to really realize that they got their cost of living raise to offset the inflation rate, and that maybe inflation isn't harming their standard of living as much as they think it is - or maybe their wages really aren't keeping up with inflation (I dunno).

I'm not sure that the average Joe really realizes how inflation effects them at all, the ratio that I am suggesting would be easier for the lay man to understand as far as how it actually effects them.
 
I'm not really looking to boil everything down to a single measure, just one that people who have no understanding of math can easily understand. A measure of our purchasing power based upon how much stuff an hour of labor would purchase.
If someone has no understanding of maths I don’t think any presentation of figures is going to give them a clear impression of a nation’s economy. In that situation, it’d probably be better for economists to explain the situation in words rather than numbers.

I think the value in this would be to be able to easily point out to people that although we have inflation, it's not really the amount of inflation that makes a difference in our lives, it's how much money we make that makes a difference, so if we have 5% inflation and 5% wage growth, we are net zero in purchasing power, not -5%.
But that example is unlikely to result in zero impact on a given individual (because nobody earns the exactly average wage or buys the same things) and wouldn’t reflect zero impact on the overall economy (because of things like external trade, taxation and the timing of impacts in different areas). Your measure is no better at giving a clear image of reality as the inflation figure does. Inflation isn’t meant to be viewed in a vacuum (especially in a "normal" range).

I have a lot of friends who constantly stop around complaining that inflation is ruining their lifestyle. I'd just like to be able to easily point out that maybe it isn't as bad as they think it is.
Well again, I don’t think you can fill that scale of gap in understanding by just using different figures. It’s also worth noting that the health of the economy (which you started talking about) is quite different to the economic health of citizens (individually or as a whole). You’d need a different set of measures to properly assess the latter.
 
I'm just wondering if the reporting of the inflation rate doesn't cloud the minds of the general public. Not really talking about economists who need to look at a broad array of data, but just the average Joe on the street. They see the inflation rate reported, but fail to really realize that they got their cost of living raise to offset the inflation rate, and that maybe inflation isn't harming their standard of living as much as they think it is - or maybe their wages really aren't keeping up with inflation (I dunno).

I'm not sure that the average Joe really realizes how inflation effects them at all, the ratio that I am suggesting would be easier for the lay man to understand as far as how it actually effects them.

Unfortunately, that is going to happen no matter what economic indicator is used to suggest what the health of the economy is. We argue about far more than just inflation measures. We also argue about income quintiles (wealth gaps,) what is impacting our GDP, consumer spending, debt, impacts of net exports being a negative number, etc.

Inflation measures always get a bad reputation because of two key factors. One, there are different ways to calculate what inflation is and what the Fed likes to look at is not necessarily what all economists like to evaluate in totality. Two and perhaps more importantly, the political spin machine of economics tends to diminish the importance of this academia. As with any subject there is a plethora of bad information that makes a political point at the expense of economics 101.

The "average Joe on the street" has no real concept of why 0% inflation is a problem, or why 2% is a reasonable target, or why 4% suggests some other problem. All they know, or think they know, is $10 dollars today buys less than it did before. Or all they know is the price of a gallon of milk went up. Without context there is no reasonable explanation, so bad assumptions are the answer. On an individual level we tend to look at things exclusively in what impacts us on that level, what ends up discarded is what is happening on a macro economic level. So these reports on where our economy is end up subject to ridicule because we all may not be seeing the exact same thing. We are even more foolish when we look to these reports and assume all impacts are equal.

Our issue here is if we dumb down economic indications (for lack of a better way to put it) we risk discarding what these reports and numbers really tell us.

We have to have multiple sources of data to tell us why the economy is headed a certain direction, and really where we are in the economic cycle because of. We may not trust what economists tell us as on an individual level as economists have their own political leans just like the rest of us, but we cannot cloud their data with our suggestions on what *should* be looked at because of layman level interpretations.

Inflation health has to remain intact, even if the average person has no idea what goes into that math or what it tells economists.
 
...It’s also worth noting that the health of the economy (which you started talking about) is quite different to the economic health of citizens (individually or as a whole). You’d need a different set of measures to properly assess the latter.

What to you think that "the economy" is? Wall Street?

In my world, the economic health of our citizens in aggregate IS the economic health of the economy. Any society in which the majority of it's citizens are suffering by loosing purchasing power, has a sick economy.
 
Your images aren't displaying. Anyhow, I think that a ratio would be easy to understand more so than the difference, although we could uses a difference (like an hour of labor has has gained or lost X% of purchasing power over Y period of time).
Dang, I was wondering if the img tag could capture https sources. I guess not.

I don't have my original file as I'm at work right now, but I'll see if I can construct something on that suggestion.

Where did that come from?!? I only suggested that there’s no benefit in trying to combine a number of separate measures in to a single output in this specific example. High wages and high prices would have different consequences and would require different responses to low wages and low prices but a combination measure of a “working hour value” wouldn’t show that difference. Economists and policy makers would need to monitor wages and prices as separate values to reach legitimate conclusions. Obviously some ratio’s, averages and combinations are necessary but that can be taken too far – it’s about the balance between simplicity and usefulness.
I understood your point. It's still silly. The fact that there's a lot going into it does not preclude us from studying it--the same goes for CPI; do you object to its use as well? The BLS already puts a lot of work into its indicators. If there's an appropriate way to use them, we might as well. There might not be--for instance, I'm somewhat worried about using averages vs medians, but that's a methodological problem. There's nothing wrong with studying complex systems as long as the methodology is sound. That necessarily involves arguing over methodology, but arguing over whether to try coming up with new ways to look at data is just silly.

Besides, this is fun.
But that example is unlikely to ... Inflation isn’t meant to be viewed in a vacuum (especially in a "normal" range).
The thing you're missing is that all basic indicators have different data series for different denominators. For instance, I'm using CPIAUCSL, which is CPI for all urban consumers, as I think urban consumers are the primary concern in this type of analysis, and I first used a data subset for service industry workers, and later used the full data set. Additionally, the fact that ECI/ECEC is broken down by both industry and region in different tables would be useful if we then wanted to narrow the metric.

If the concern is that people who actively and/or professionally look at economic indicators aren't served by a single one--yeah, they know.

couldn't you just use median income adjusted for inflation?
Yea, thats pretty much what I am talking about.
...
How much stuff we can purchase is all most people really care about anyhow.
Originally you said you wanted to capture income per labor time, and median income doesn't capture labor time. While I see that you could use median income instead, if the goal is to look at purchasing power + inflation, I think the time and energy spent on that purchasing power is as interestingly relevant as you originally made it out to be.

Let me close by saying the whole purpose of economics as an academia is to observe function and behavior. Inflation measures tend to upset people as some look at it as "unregulated taxation" or "theft of income," but those groups tend to ignore all the other economic indicators when doing so. Worse, they tend to ignore what the economics of the matter tells us about the difference between healthy and unhealthy inflation. All the numbers go into that evaluation and show us why we want a 2% inflation.

When engaging in looking at one number without any context, you get ... :scared:
I'm reminded of a problem I faced when I sat on institutional data review committees for my old college. There is enormous frustration among experts of any field with the multitudes of people who examine catchy numbers without understanding its context, it is true. But part of the reason we have these different metric definitions is that they are a method by which we communicate information, and so coming up with new metrics isn't altogether a bad practice (and it also has the side benefit of changing the framework of conversation).

After all, all the metrics we have now (and there are quite a lot) all had to be developed from more rudimentary data, and many (like CPI) is now a staple in econometrics.
 
Last edited:
If the median wage was $17.36, then that would be the median labor hour. The point where half the people make more, and half make less.

The issue with inflation is that it doesn't take into account inflation or deflation of our wages. So like if we have 1% inflation, but we have 2% hourly wage growth, then a wage earners purchasing power hasn't declined by 1%, it's actually increased by 1%..

But the CPI isn't meant to measure purchasing power...it's meant to measure change in cost of living. And since the CPI measures change is cost at a constant standard of living, including changes in income would distort that.

So, as I believe has already been suggested...the closest to what you want would be a constant dollar ECI, where the ECI wages and salaries is combined with the CPI-U to give a measure of change in purchasing power.

What you do is simply set the ECI wages and salaries and the CPI-U to 100 for the same time period and for each month after that divide the ECI by the CPI.
For example.....in the last year, the ECI increased 2% and the CPI-U 0.9% So 102/100.9=1.011 That means purchasing power has increased 1.1%
 
Anyhow, I think that a ratio would be easy to understand more so than the difference
Actually, I think the ratio is much more appropriate once I thought about it. CPI is essentially the percent change from consumer prices in 1982-1984--functionally, you can treat it as a dollar amount. Therefore wages/CPI functionally indicates the amount of stuff one can buy.


I reconstructed the ECEC/CPI ratio.

I realized since the ECEC was broken into quarters, I could calculate it quarterly as well.

All workers alone is still a pretty boring metric over this time period--I mean, it's really only 3-4% up or down, with a slope so gradually positive we might as well call it flat. But, when you compare with service occupations, something slightly interesting comes out:

pppmwh proposal ecec over cpi.png

Specifically, the method here is taking the quarterly average hourly wages as reported in ECEC, Wages and Salaries, and dividing by CPI-U, then indexing them to their respective March 2004 values. The divergent effect is less clear when you index them to the "all workers" march 2004 value, as generally the wage values for service occupations are around 60% of that of the civilian (all) workers table, meaning that the two (still relatively flat) lines sit one 40 or so percentage points above the other. The difference in slope is what interested me, which is why I chose to equate their respective indices, as this chart now shows that divergence more clearly.
 
Actually, I think the ratio is much more appropriate once I thought about it. CPI is essentially the percent change from consumer prices in 1982-1984--functionally, you can treat it as a dollar amount. Therefore wages/CPI functionally indicates the amount of stuff one can buy.


I reconstructed the ECEC/CPI ratio.

I realized since the ECEC was broken into quarters, I could calculate it quarterly as well.

All workers alone is still a pretty boring metric over this time period--I mean, it's really only 3-4% up or down, with a slope so gradually positive we might as well call it flat. But, when you compare with service occupations, something slightly interesting comes out:

View attachment 67201317

Specifically, the method here is taking the quarterly average hourly wages as reported in ECEC, Wages and Salaries, and dividing by CPI-U, then indexing them to their respective March 2004 values. The divergent effect is less clear when you index them to the "all workers" march 2004 value, as generally the wage values for service occupations are around 60% of that of the civilian (all) workers table, meaning that the two (still relatively flat) lines sit one 40 or so percentage points above the other. The difference in slope is what interested me, which is why I chose to equate their respective indices, as this chart now shows that divergence more clearly.

No, don't use the ECEC...use the ECI wages and salaries (not total compensation). when looking at purchasing power, including benefits distorts the picture.

fredgraph.png
 
No, don't use the ECEC...use the ECI wages and salaries (not total compensation). when looking at purchasing power, including benefits distorts the picture.
I don't include benefits, there's a table for only wages and salary in the ECEC.

Still, I'm not clear on the functional difference between ECEC and ECI as used in the ratio--Given that ECEC was straight-up dollar wages rather than an index I didn't completely understand, I figured it was safer to use--if you view CPI as a dollar amount, ECEC/CPI could be seen as the amount of stuff one can buy for an hour of work.
 
Last edited:
The "average Joe on the street" has no real concept of why 0% inflation is a problem, or why 2% is a reasonable target, or why 4% suggests some other problem.

I wish there was an exasperated emoji.
 
If the median wage was $17.36, then that would be the median labor hour. The point where half the people make more, and half make less.

The issue with inflation is that it doesn't take into account inflation or deflation of our wages. So like if we have 1% inflation, but we have 2% hourly wage growth, then a wage earners purchasing power hasn't declined by 1%, it's actually increased by 1%.

A friend of mine constantly harps on how inflation is theft, and how the dollar has lost 97% of it's purchasing power since 1913, yet he never seems to notice that the average American is paid about 50 times more than we were paid back then. Thus, having an official wage vs cost of stuff metric seems like it would have value in economic discussions.

You and I get into this from time to time.. but simple put..

Wages are sticky, they actually don't deflate and never have but because wages are sticky you have more layoffs in recessions. So median wages drop for the whole but for those working it's actually stayed the same.

Your friends inflation number is wrong.. In reality it's something like this.. $1 in 1913 is = to $24.19 in 2015. That's more then 97%.
 
Is there a published metric for units of production purchased by a specific unit of labor?

Yes, it is called GDP per capita. (But you must correct per capita for "units of labor". So, take GDP per capita (which is a common statistic) and multiply it by the inverse of the Employment to Population Ratio.)

Or, more simply, just go here: GDP per person employed - published by the World Bank.

Now, what would you like to do with it ... ?
 
... but held generally level between 1984 to 1996, and then started plummeting again in 1996 (Clinton. Go figure).

What is your intimation.?

That Bill Clinton is responsible for ALL economic quirks whilst he was PotUS?

Wow ... !
 
What is your intimation.?

That Bill Clinton is responsible for ALL economic quirks whilst he was PotUS?

Wow ... !
You know this thread isn't that long. You could read it before you say something irrelevant.

But I suppose that'd be asking too much.
 
THE KEY INFLUENCE OF MARKET6OVERSIGHT AUTHORITIES

So median wages drop for the whole but for those working it's actually stayed the same.

Unless they get fired and try to get back to work at the same general wage-rate.

There is no Economic Law on earth that dictates that wages must be either forever constant or growing.

Labor is most often the "key" input to the production process (of economic goods and services); and like material or energy is subject to the laws of Supply & Demand. It is we humans who think that wages must always go up and never down. Those, that is, who do not understand the immutable law of Supply & Demand even for Labor inputs to any commercial activity.

What's an economy to do, especially in terms of policy? Market Oversight authorities can help by making sure that a market-economy is fair and equitable. That is, that no "illegal manipulation" of either input to the market of Supply or Demand occurs. As the US failed to do with in the Personal Computer Market explosion of the 1980s.

My Opinion: America failed miserably at the task of allowing dual Operating Systems to compete in a wholly new market for Personal Computers. It did this when Oversight Authorities should have interfered with the outcome of CP/M in its version as DR-DOS (that belonged to Digital Research) to compete with Microsoft's MS-DOS by directing that both Operating Systems be purchased as PC Operating Systems by the US government. Instead of letting it become "absorbed" by Microsoft. This is, I suggest, a prime-example of Market Oversight Failure to promote competition on the part of governments.

Which underlines the key-fact of any particular market having truly multiple- and competitive-players, and which does NOT consolidate into just two or three (where connivance becomes possible).

I don't recall at any moment that anybody at the Federal Trade Commission or the DofJ ever evoked this premise as a key to market-oversight and control by any government authority. The most recent example being that the neither the FTC nor the DoJ tried to prohibit the massive consolidation in Banking pre-2008 ...
____________________________________
 
The most recent example being that the neither the FTC nor the DoJ tried to prohibit the massive consolidation in Banking pre-2008

Which is why the sole purpose of market-agglomeration is to market-integrate sales-volumes into one small group or a specific conglomerate grouping of companies must remain illegal.

By means of reduced competition, the consolidation simply increases the profits accrued to these specific groups; which (given the miserably low upper-income taxation rates) simply enhance the revenue-to-wealth streams of a minutely small group of American households. (Only about 11% of all American households, according to Domhoff's research - here.)

Oh, yes, I forgot, some of us playing the market are able to benefit from the high stock-market valuations/dividends that ensue. But that is not legal, since said benefits are derived by an unfair manipulation of market-structures. Which means, a small population of "smarter-than-usual" market-players are benefiting from the non-competitive pricing of "oligopolistic markets".

Which is the high-minded business of those firms who refuse YOUR business because the amounts you want to invest in stock-markets does not conform with prefixed minimum values.

What an amazing world we live in, and (as consumers) are we ever getting shucked. (Which rhymes with another word we are not supposed to use here. ;^)
_____________________
 
...

There is no Economic Law on earth that dictates that wages must be either forever constant or growing....__

No economic law, but people rarely keep a good attitude when their employer decreases their wage, so during wage deflationary times, there becomes a motivation for employers to have a high turnover rate, and then start new hires at lower and lower wages.
 
... when their employer decreases their wage, so during wage deflationary times, there becomes a motivation for employers to have a high turnover rate, and then start new hires at lower and lower wages.

I am sure that during the recent Great Recession what you describe happened. But no employment-contract on earth stipulates employment forever.

During any contraction of business volume, it is simple management practice to adjust production to level of demand for products/services. If that means getting rid of workers, it produces layoffs.

There is no simple way to get around that "law of the jungle" ... the best logic is to avoid the worst.

The Replicant Party must reform itself around other values ...

So, I say, be careful about the Replicant Party that refused Stimulus Spending the objective of which was to sustain Economic Demand, thus preserving employment with the objective if increasing it.

This party was wicked to have refused spending that would have created jobs, just for the sake of unseating a PotUS they disliked immensely. That sort of political nonsense is decidedly NOT "fair play".

Which is why America is going down the tubes. When emotion takes the place of good reason in politics, then the worst happens ...
__________________
 
Back
Top Bottom