Yes, indeed, your chart would be of great value if time and life stood still and events didn't happen in the world that sideline the best laid plans. If you'll recall, Bush 43 ran on a platform of removing America from nation building and other international activities. 9/11 kind of put the kibosh on that policy.
Err, what? The chart is from 2013, long after those policies went into effect. It's not making an assessment based on Bush's policies before 9/11, and it's not like Bush backed down on his tax cuts after starting his second war, either.
The fact remains, however, that the Bush tax cuts generated increased economic activity, increased employment, and increased income tax and other revenue into the federal treasury.
Uh, no, that's not much of a fact. Revenues went up, not because "tax cuts stimulate spending!" but because the real estate and finance bubbles were generating lots of economic activity. Since he didn't create the bubble, it doesn't make sense to credit his policies for the fiscal effects of that bubble.
That kind of supply-side thinking -- that tax cuts pay for themselves -- has no real evidentiary basis. The closest you might get to that is when tax rates are extremely high. The Laffer Curve makes sense when top marginal tax rates are closer to 90% than 35%. (cf
http://www.nytimes.com/2015/03/17/upshot/tax-cuts-still-dont-pay-for-themselves.html?_r=0 for a fairly typical summary of the arguments)
Some of his tax cuts helped the economy, but very little. E.g. the 2008 rebate check was a stimulus program, cast as a tax cut. However, all it did was give GDP a tiny boost for one quarter. Most of the tax cuts went to the wealthy, who already tend to hoard most of their cash. Since they don't spend it, it does not significantly improve the economy.
Keep in mind that interest rates were also exceptionally low during that period -- and that wasn't a Bush policy as much as a Greenspan one. E.g. claims that cutting corporate taxes would provide more capital for investment doesn't make much sense, when it is so incredibly cheap to borrow instead, and provides potential tax breaks to boot.
Last but not least, almost none of the Bush tax cuts were repealed during the Obama years. Why wasn't the recovery faster, then? Why didn't the economy come roaring back? Are the economic benefits of a tax cut limited to, say, 5 years after they start? Does their benefit end, when the President who signed them leave office?
Or, in classic webspeak: "Correlation does not prove causation."
Your chart is lax in recognizing that increase in revenue.
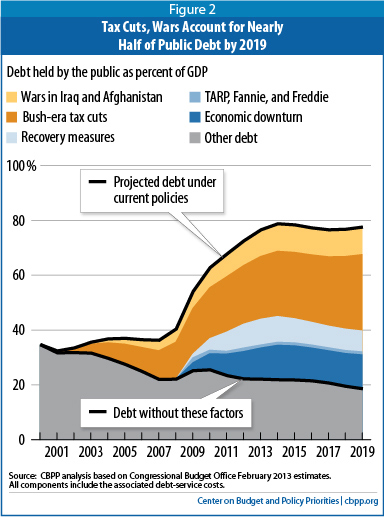
Erm.... Yeah, that's not the purpose of the chart. It's showing how Bush's policies had long-term effects on public debt.
We should also note that -- surprise! -- we went from a surplus to massive deficits and debts during his term, and the effects of his policy choices and the recession extended well into the Obama years. His tax cuts remained, the wars he started continued, Medicare Part D was not going away.
I.e. even if we accept your claim that "the economy was great because of Bush's policies," you'd still have to recognize that those same policies don't produce sustained growth, and dramatically increased federal debt. What's the phrase? Robbing Peter to pay Paul?
")
Clearly, however, there were also increased costs to the nation related to the wars, homeland security, and other recovery initiatives necessitated both at the beginning and the end of the Bush administration. The point, however, wasn't that the Bush administration reduced debt but that the Bush administration policies improved the economy for the majority of his term in office.
Or, he got lucky, and happened to be President at a time when the economy was in one of the biggest bubbles in modern history.