And still better than Bush, as I just showed you in terms of underemployment.
Bush: 115,505 additional underemployed on average per month
Obama: 106,333 additional underemployed on average per month
Obama is doing better than Bush, yet you would vote for Bush again if you could and criticize others for voting for Obama. :roll:
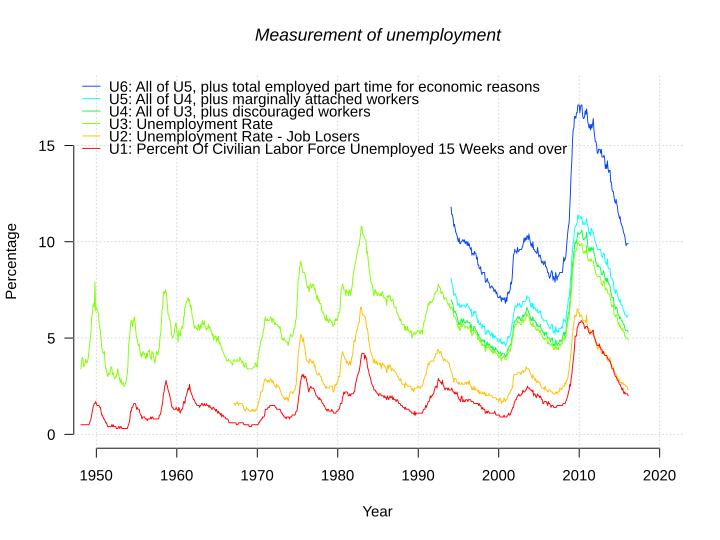
U-6 Unemployment rate
Year Jan Feb Mar Apr May Jun Jul Aug Sep Oct Nov Dec
2001 7.3 7.4 7.3 7.4 7.5 7.9 7.8 8.1 8.7 9.3 9.4 9.6
2002 9.5 9.5 9.4 9.7 9.5 9.5 9.6 9.6 9.6 9.6 9.7 9.8
2003 10.0 10.2 10.0 10.2 10.1 10.3 10.3 10.1 10.4 10.2 10.0 9.8
2004 9.9 9.7 10.0 9.6 9.6 9.5 9.5 9.4 9.4 9.7 9.4 9.2
2005 9.3 9.3 9.1 8.9 8.9 9.0 8.8 8.9 9.0 8.7 8.7 8.6
2006 8.4 8.4 8.2 8.1 8.2 8.4 8.5 8.4 8.0 8.2 8.1 7.9
2007 8.4 8.1 8.0 8.2 8.2 8.3 8.4 8.5 8.4 8.4 8.5 8.8
2008 9.1 8.9 9.0 9.2 9.7 10.1 10.5 10.9 11.2 11.9 12.7 13.6
2009 14.1 15.0 15.6 15.8 16.4 16.6 16.5 16.8 17.0 17.4 17.1 17.2
2010 16.5 16.8 16.8 17.0 16.5 16.5 16.5 16.7 17.1 17.0 17.0 16.7
2011 16.1 15.9 15.7 15.9 15.8 16.2 16.1 16.2
Discouraged workers
2001 301 287 349 349 328 294 310 337 285 331 328 348 321
2002 328 375 330 320 414 342 405 378 392 359 385 403 369
2003 449 450 474 437 482 478 470 503 388 462 457 433 457
2004 432 484 514 492 476 478 504 534 412 429 392 442 466
2005 515 485 480 393 392 476 499 384 362 392 404 451 436
2006 396 386 451 381 323 481 428 448 325 331 349 274 381
2007 442 375 381 399 368 401 367 392 276 320 349 363 369
2008 467 396 401 412 400 420 461 381 467 484 608 642 462
2009 734 731 685 740 792 793 796 758 706 808 861 929 778
2010 1065 1204 994 1197 1083 1207 1185 1110 1209 1219 1282 1318 1173
2011 993 1020 921 989 822 982 1119