• This is a political forum that is non-biased/non-partisan and treats every person's position on topics equally. This debate forum is not aligned to any political party. In today's politics, many ideas are split between and even within all the political parties. Often we find ourselves agreeing on one platform but some topics break our mold. We are here to discuss them in a civil political debate. If this is your first visit to our political forums, be sure to check out the RULES. Registering for debate politics is necessary before posting. Register today to participate - it's free!
  • Welcome to our archives. No new posts are allowed here.

Opposition to Obama grows - strongly

Status
Not open for further replies.
Yeah, everyone is lying except you.
FactCheck.org
Q: During the Clinton administration was the federal budget balanced? Was the federal deficit erased?
A: Yes to both questions, whether you count Social Security or not.

FULL ANSWER
This chart, based on historical figures from the nonpartisan Congressional Budget Office, shows the total deficit or surplus for each fiscal year from 1990 through 2006. Keep in mind that fiscal years begin Oct. 1, so the first year that can be counted as a Clinton year is fiscal 1994. The appropriations bills for fiscal years 1990 through 1993 were signed by Bill Clinton’s predecessor, George H.W. Bush. Fiscal 2002 is the first for which President George W. Bush signed the appropriations bills, and the first to show the effect of his tax cuts.
FederalDeficit(1).jpg

The Clinton years showed the effects of a large tax increase that Clinton pushed through in his first year, and that Republicans incorrectly claim is the "largest tax increase in history." It fell almost exclusively on upper-income taxpayers. Clinton’s fiscal 1994 budget also contained some spending restraints. An equally if not more powerful influence was the booming economy and huge gains in the stock markets, the so-called dot-com bubble, which brought in hundreds of millions in unanticipated tax revenue from taxes on capital gains and rising salaries.

Clinton’s large budget surpluses also owe much to the Social Security tax on payrolls. Social Security taxes now bring in more than the cost of current benefits, and the "Social Security surplus" makes the total deficit or surplus figures look better than they would if Social Security wasn’t counted. But even if we remove Social Security from the equation, there was a surplus of $1.9 billion in fiscal 1999 and $86.4 billion in fiscal 2000. So any way you count it, the federal budget was balanced and the deficit was erased, if only for a while.

Well, then you are going to have to take that up with the U.S. Treasury Dept which of course you never will. As has been posted the actual debt per year shows no deficit so if there was a surplus why did we pay debt service on more debt each year? Debt service is part of the budget which I know you understand. You can get the debt service by year by going to the U.S. Treasury site. Suggest you go there and get the actual data, not fact check or CBO, sites which mean nothing.
 
If you can show how Bush, in 30 days, could have caused the end of the .com bubble, then you win a prize.

I will as soon as you can prove to me how all of Bush's spending is now Obama's spending.

One such tactic they’re using these days is to blame Obama for some of the massive increases in federal spending that occurred during the eight years of Bush’s two terms. A Google search for “federal spending under Obama” and related terms yields a wide variety of articles and media stories (largely from Foxnews) blaming Obama for the massive spending increases that occurred during the 2009 fiscal year.
This is very clever of course, since few people out in the public understand how federal budgeting works, but the fact is that the spending that occurred during the 2009 fiscal year is almost totally the result of appropriations bills signed by George W. Bush during the 2008 calendar year. By shifting Bush’s 2009 spending to Obama, one can then understate the amount of federal spending authorized by Bush while inflating the spending authorized by Obama. This then helps perpetuate the myth that one party is more “responsible” with taxpayer funds than the other party.
Bush’s Huge Budget Numbers Blamed on Obama

Who said all of Bush spending was Obama's? Getting a little desparate here. If you are going to blame Bush for the recession that began in March, the Obama is responsible for all the spending from the time he took office which was then a record deficit for 2009 which added to the 2010-2011 spending, none of which was Bush's totals over 4.2 trillion dollars.
 
Who said all of Bush spending was Obama's? Getting a little desparate here. If you are going to blame Bush for the recession that began in March, the Obama is responsible for all the spending from the time he took office which was then a record deficit for 2009 which added to the 2010-2011 spending, none of which was Bush's totals over 4.2 trillion dollars.

He's punch drunk because he and I have been battling a few in here for a while today actually making that claim. Honestly. That is their argument. lol
 
He's punch drunk because he and I have been battling a few in here for a while today actually making that claim. Honestly. That is their argument. lol

My grandkids had half a day of school today and it seems that is the case all over the country as I have been here all day as well. It does seem that the education system has failed a lot of people when we have people who don't understand basic civics for if they did they would understand that the 2009 budget was passed by the Democrat controlled Congress and mostly spent by the Democrat President after he took office in January 2009 yet for some reason they blame Bush. As has been pointed out 4.2 trillion has been added to the debt since the end of fiscal year 2008 so instead of blaming Bush for all that where is the accountability for Obama?
 
Obama economic results in 2011,
.4% GDP and 1.3% GDP growth in 2011(bea.gov)

From http://www.bea.gov/national/xls/gdpchg.xls:
The mean GDP growth from 1998 to 2007 was 5.37%. That includes the years of the dot com boom, and does not include any of the recession years. What is more telling is the average percentage change which is -.063011%. What that means is that GDP had already begun growing at a smaller rate as 1998 to 2007 progressed.

Now, lets switch to quarters, which are the numbers you were using. During the Bush years, the average GDP growth per year was:

Under George W Bush, the mean change in GDP per quarter (using 2005 dollars) was 2.19%. I excluded the last two quarters of his term as they were the beginning of the recession and are statistical outliers. I will also remove the first two quarters from Obama's tenure as they are also outliers.

Conclusion

The mean percent growth using 2005 dollars during Obama's tenure (excluding the outliers) is 2.4625%. The GDP has, on average, grown faster during Obama's tenure than it did during George Bush's.

25+ million unemployed or under employed Americans in 2011(bls.gov)
Notice: Data not available: U.S. Bureau of Labor Statistics
From 09/09 to 09/11, the labor force has grown by 77,000. Unemployment rates hit their peak around that time, and have been falling ever since.

2.6 million fewer jobs(bls.gov)
Notice: Data not available: U.S. Bureau of Labor Statistics
That does not appear to be the case. The president does not begin to implement their own policies until around September after the election year. So, from 09/09 to 09/11, a total of 1,234,000 jobs have been added.

4.2 trillion added to the debt in less than 3 years(U.S. Treasury Site)

Yes, from "Debt By the Penny", it appears debt from Sept `09-Sept '11 has increased by about 3 trillion. However, under Bush, the debt increase from Sept `07 - Sept '09 is 2.779 trillion. That's a difference of of 7%. It is substantial, I would like to see it dropped, but it is not as jaw-dropping as your statistic would have you believe.

Downgrade of the U.S. credit rating(S&P)

There is nothing anyone can say to you about this. The S&P was very clear that the biggest reason our credit was downgraded was due to the hyper-partisanship displayed in Congress. The budget was also a major factor.

Rising Misery index 7.83 to 12.97

The United States Misery Index
It is simply the unemployment rate added to the inflation rate. It is assumed that both a higher rate of unemployment and a worsening of inflation both create economic and social costs for a country. A combination of rising inflation and more people out of work implies a deterioration in economic performance and a rise in the misery index.

Yeah, no ****, that's what happens when you inherit an economy in shambles. The misery index was at 11.4% during the last few months of the Bush administration.

38-41% JAR

I have no idea what this is. Sorry.

and well over 50-55% disapproval ratings(Gallup)

Yes, and from the Gallop Poll, Reagan was a 47% approval rating in his third year, only 6 percentage points above Obama. Who gives a damn? No wonder so many people disapprove when they listen to the nonsense you post.
 
Last edited:
whysoserious;1059892625]Obama economic results in 2011,
.4% GDP and 1.3% GDP growth in 2011(bea.gov)

From http://www.bea.gov/national/xls/gdpchg.xls:
The mean GDP growth from 1998 to 2007 was 5.37%. That includes the years of the dot com boom, and does not include any of the recession years. What is more telling is the average percentage change which is -.063011%. What that means is that GDP had already begun growing at a smaller rate as 1998 to 2007 progressed.

Now, lets switch to quarters, which are the numbers you were using. During the Bush years, the average GDP growth per year was:

Under George W Bush, the mean change in GDP per quarter (using 2005 dollars) was 2.19%. I excluded the last two quarters of his term as they were the beginning of the recession and are statistical outliers. I will also remove the first two quarters from Obama's tenure as they are also outliers.

Conclusion

The mean percent growth using 2005 dollars during Obama's tenure (excluding the outliers) is 2.4625%. The GDP has, on average, grown faster during Obama's tenure than it did during George Bush's.

Why are you using 2005 dollars and not current dollars, BEA.gov shows the numbers I posted and came out in the Commerce report release so comparing 2011 information to 2010 data the numbers are shrinking which shows that Obama policies failing

25+ million unemployed or under employed Americans in 2011(bls.gov)
Notice: Data not available: U.S. Bureau of Labor Statistics
From 09/09 to 09/11, the labor force has grown by 77,000. Unemployment rates hit their peak around that time, and have been falling ever since.

Labor force data says differently. In order to get the labor force you have to use the unemployment link to get the employment data because unemployment is calculated by taking the unemployed divided by the labor force. The labor force is over 154 million and 16.5% of that number being U-6 totals over 25 million

[
U]2.6 million fewer jobs(bls.gov)[/U]
Notice: Data not available: U.S. Bureau of Labor Statistics
That does not appear to be the case. The president does not begin to implement their own policies until around September after the election year. So, from 09/09 to 09/11, a total of 1,234,000 jobs have been added.


Labor Force Statistics from the Current Population Survey
Original Data Value

Series Id: LNS12000000 Dec-07 Jun-09
Seasonally Adjusted Mar-01 Nov-01
Series title: (Seas) Employment Level Jul-90 Mar-91
Labor force status: Employed Jul-81 Nov-82
Type of data: Number in thousands
Age: 16 years and over
Years: 1980 to 2010

Year Jan Feb Mar Apr May Jun Jul Aug Sep Oct Nov Dec

2009 142221 141687 140854 140902 140438 140038 139817 139433 138768 138242 138381 137792
2010 138333 138641 138905 139455 139420 139119 138960 139250 139391 139061 138888 139206
2011 139323 139573 139864 139674 139779 139334 139296 139627

That is 2.6 million fewer people employed today than when he took office


4.2 trillion added to the debt in less than 3 years(U.S. Treasury Site)

Yes, from "Debt By the Penny", it appears debt from Sept `09-Sept '11 has increased by about 3 trillion. However, under Bush, the debt increase from Sept `07 - Sept '09 is 2.779 trillion. That's a difference of of 7%. It is substantial, I would like to see it dropped, but it is not as jaw-dropping as your statistic would have you believe.

Bush isn't in office and that had nothing to do with the information posted. Debt at the end of fiscal year 2008 was 10.6 trillion and it is 14.8 trillion right now

Downgrade of the U.S. credit rating(S&P)

There is nothing anyone can say to you about this. The S&P was very clear that the biggest reason our credit was downgraded was due to the hyper-partisanship displayed in Congress. The budget was also a major factor.

There is nothing to say, that is a fact

Rising Misery index 7.83 to 12.97

The United States Misery Index


Yeah, no ****, that's what happens when you inherit an economy in shambles. The misery index was at 11.4% during the last few months of the Bush administration.

It is 2011, three years later and the misery index when he took office was 7.83

[
U]38-41% JAR [/U]

I have no idea what this is. Sorry.

JAR=Job Approval Rating

and well over 50-55% disapproval ratings(Gallup)

Yes, and from the Gallop Poll, Reagan was a 47% approval rating in his third year, only 6 percentage points above Obama. Who gives a damn? No wonder so many people disapprove when they listen to the nonsense you post.

Nice try but total failure. What is it about liberalism that creates such loyalty?
 
Last edited:
Ha,ha, another Republican created myth. You should follow your own advice, "you can have your own opinion, but not your own facts". As I recall, Bush was in office on March 2001.

The NBER's Business Cycle Dating Committee has determined that a peak in business activity occurred in the U.S. economy in March 2001. A peak marks the end of an expansion and the beginning of a recession. The determination of a peak date in March is thus a determination that the expansion that began in March 1991 ended in March 2001 and a recession began. The expansion lasted exactly 10 years, the longest in the NBER's chronology.

The Business-Cycle Peak of March 2001

Ahhh, so the recession "officially" started less than two months after Bush took office, so it's his fault ?????

The economy was just humming along until then right ????

As the Dot Com bubble occurred in the mid and late 1990s, assorted predictions that eventually the bubble would burst emerged frequently. The Federal Reserve raised interest rates six times between June 1999 and May 2000 in an effort to cool the economy to a soft landing. The actual burst of the stock market bubble occurred in the form of the NASDAQ crash in March 2000. Growth in gross domestic product slowed considerably in the third quarter of 2000 to the lowest rate since a contraction in the first quarter of 1991.

The current recession officially ended in July 2009. Aren't you glad it's been over for 2 1/2 years and we are all so much better off. ( hint: the "official" start and end dates for recession don't mean jack****.)

You are too funny.
 
My grandkids had half a day of school today and it seems that is the case all over the country as I have been here all day as well. It does seem that the education system has failed a lot of people when we have people who don't understand basic civics for if they did they would understand that the 2009 budget was passed by the Democrat controlled Congress and mostly spent by the Democrat President after he took office in January 2009 yet for some reason they blame Bush. As has been pointed out 4.2 trillion has been added to the debt since the end of fiscal year 2008 so instead of blaming Bush for all that where is the accountability for Obama?

As I said before...

1) cut
2) paste
3) get debunked
4) spiiiiiiiiiiiiiiiinnnnnnnn
5) make personal insult
 
Why are you using 2005 dollars and not current dollars, BEA.gov shows the numbers I posted and came out in the Commerce report release so comparing 2011 information to 2010 data the numbers are shrinking which shows that Obama policies failing

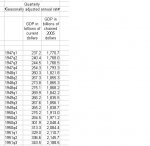
Using one year's dollars is how you just for inflation. Your source and mine, bea.gov, chose to use 2005 dollars. Here is the link (I'll post a screen shot but I had to do some Excel Work to get the averages):

http://www.bea.gov/national/xls/gdpchg.xls
2005 dollars.JPG

See where it says GDB in billions of chained 2005 dollars. Those are the numbers I used, as they are inflation adjusted dollars.
 
Ahhh, so the recession "officially" started less than two months after Bush took office, so it's his fault ?????

The economy was just humming along until then right ????


The current recession officially ended in July 2009. Aren't you glad it's been over for 2 1/2 years and we are all so much better off. ( hint: the "official" start and end dates for recession don't mean jack****.)

You are too funny.

Official start and end dates do matter but they do not tell the whole story of how it began or ended. They are good on figuring out where to start an investigation. They are an existence factor in that "this is when they existed" but they aren't a determining factor in why they existed.
 
Using one year's dollars is how you just for inflation. Your source and mine, bea.gov, chose to use 2005 dollars. Here is the link (I'll post a screen shot but I had to do some Excel Work to get the averages):

http://www.bea.gov/national/xls/gdpchg.xls
View attachment 67117096

See where it says GDB in billions of chained 2005 dollars. Those are the numbers I used, as they are inflation adjusted dollars.

Better tell that to the Commerce Dept who then screwed up their release. 2005 dollars mean nothing today, the numbers are what they are and affect both revenue and expenses.

Don't see Commerce Department using 2005 numbers

National Income and Product Accounts
Gross Domestic Product, 2nd quarter 2011 (third estimate)

Corporate Profits, 2nd quarter 2011 (revised estimate)

Real gross domestic product -- the output of goods and services produced by labor and property
located in the United States -- increased at an annual rate of 1.3 percent in the second quarter of 2011,
(that is, from the first quarter to the second quarter), according to the "third" estimate released by the
Bureau of Economic Analysis. In the first quarter, real GDP increased 0.4 percent.
 
Last edited:
Well, then you are going to have to take that up with the U.S. Treasury Dept which of course you never will. As has been posted the actual debt per year shows no deficit so if there was a surplus why did we pay debt service on more debt each year? Debt service is part of the budget which I know you understand. You can get the debt service by year by going to the U.S. Treasury site. Suggest you go there and get the actual data, not fact check or CBO, sites which mean nothing.

I explained it to you before, but as usual, you don't listen and stick to your rehearsed and tired rhetoric.

There is the "Total debt" and "Debt held by the public". The difference between the two numbers is debt that is held by the government, called Inter-Government debt. Its owned by government agencies such as the SS Administration and Medicare, etc. The CBO only takes into consideration the debt held by the public because the government paying interest to itself is irrelevant to the budget. The interest on the inter-government held debt still has to be paid. Instead of it being reflected in the budget, it is simply added to the inter-government debt.

The change from using Total Debt to Debt held by the public in CBO calculations of the budget was made during the Clinton adm. and this is where the budget surpluses came from. Thus Total debt can still increase while the CBO indicates a budget surplus because of an increase in inter-government debt.

Also:

Budget Surpluses, Deficits and Government Spending

Executive Summary

The emergence of a budget surplus raises several questions: is federal fiscal behavior impacted when government revenues exceed outlays? Do surpluses one year induce spending the next year? Historically, have surpluses ever led to tax reduction? Debt reduction?
Applying econometric analysis to federal budgetary data extending back to the George Washington administration but emphasizing the post-war era, the authors conclude:

  • Over the full sweep of constitutional history, on average 37 cents of each one dollar surplus were used for increased federal spending in the following year;
  • The propensity to spend out of budget surpluses has risen significantly over time, and in the postwar era at least 60 cents of each surplus dollar were spent the next year;
  • Early in the Republic, a majority of surpluses were returned to taxpayers in the form of lower taxes; in the modern era, very little if any of surplus funds were used for tax reduction;
  • Likewise, the persistence of surpluses has declined; before 1930, on three occasions surpluses lasted 10 or more consecutive years; more than 40 years has past since the last back-to-back surpluses; consequently, only a small portion of surpluses in the modern era typically goes for debt reduction;
  • Surpluses arising right after World War II, in the mid-1950s, and in 1969 were quickly dissipated by major spending increases;
  • If Social Security is excluded from the budget, the same major finding holds: budget surpluses one year induce government spending that absorbs most of that surplus during the following year;
  • There is a negative relationship between federal spending as a percent of total output and economic growth; if surpluses typically induce higher spending, one economic growth strategy would be to reduce those surpluses through revenue-reducing tax reform. Budget Surpluses, Deficits and Government Spending

With all that gobbly goop you come up with no surplus and thus an increase in debt and debt service. Keep spinning it as if it is even of value today. Obama is in office, this thread is about the opposition to Obama so explain to me why these numbers have lead to your support? Guess you are part of that upper 30's support for the empty suit in the WH. For someone so outraged over the Bush numbers you certainly are ignoring the Obama numbers. Says a lot about you

Obama economic results in 2011,
.4% GDP and 1.3% GDP growth in 2011(bea.gov)
25+ million unemployed or under employed Americans in 2011(bls.gov)
2.6 million fewer jobs(bls.gov)
4.2 trillion added to the debt in less than 3 years(U.S. Treasury Site)
Downgrade of the U.S. credit rating(S&P)
Rising Misery index 7.83 to 12.97 (The United States Misery Index By Year)
38-41% JAR and well over 50-55% disapproval ratings(Gallup)
 
Who said all of Bush spending was Obama's? Getting a little desparate here. If you are going to blame Bush for the recession that began in March, the Obama is responsible for all the spending from the time he took office which was then a record deficit for 2009 which added to the 2010-2011 spending, none of which was Bush's totals over 4.2 trillion dollars.

You sure have been trying to paint Obama as the big spender - so, you don't like it when Bush is accused of a recession, but at the same time you sure like to dump all of Bush's 2009 spending on Obama, because if you don't, then your previous post are lies.

Some Republicans, for instance, complain that Obama tripled the budget deficit in his first year. This assertion is understandable, since the deficit jumped from about $450 billion in 2008 to $1.4 trillion in 2009. As this chart illustrates, with the Bush years in green, it appears as if Obama's policies have led to an explosion of debt.
But there is one rather important detail that makes a big difference. The chart is based on the assumption that the current administration should be blamed for the 2009 fiscal year.
mitchell-122909-1.jpg


While this might make sense to a casual observer, it is largely untrue. The 2009 fiscal year began Oct. 1, 2008, nearly four months before Obama took office. The budget for the entire fiscal year was largely set in place while President Bush was in the White House.
So if we update the chart to show the Bush fiscal years in green, we can see that Obama is mostly right in claiming that he inherited a mess.
mitchell-122909-2.jpg

Some readers, particularly Republicans, are probably thinking I'm letting Obama off the hook too easily.
mitchell-122909-3.jpg


What about the so-called stimulus, they will ask, with its $787 billion price tag? Or the omnibus fiscal-year 2009 appropriations bill? And how about Cash for Clunkers and Obama's expansion of the children's health insurance program? Didn't these all boost spending in 2009?
The answer is yes. But these boondoggles amounted to just a tiny percentage of FY2009 spending — about $140 billion out of a $3.5 trillion budget — as the pie chart nearby illustrates.
 
With all that gobbly goop you come up with no surplus and thus an increase in debt and debt service. Keep spinning it as if it is even of value today. Obama is in office, this thread is about the opposition to Obama so explain to me why these numbers have lead to your support? Guess you are part of that upper 30's support for the empty suit in the WH. For someone so outraged over the Bush numbers you certainly are ignoring the Obama numbers. Says a lot about you

Obama economic results in 2011,
.4% GDP and 1.3% GDP growth in 2011(bea.gov)
25+ million unemployed or under employed Americans in 2011(bls.gov)
2.6 million fewer jobs(bls.gov)
4.2 trillion added to the debt in less than 3 years(U.S. Treasury Site)
Downgrade of the U.S. credit rating(S&P)
Rising Misery index 7.83 to 12.97 (The United States Misery Index By Year)
38-41% JAR and well over 50-55% disapproval ratings(Gallup)

Conservative's bullcrap nonstop cut and paste debunked here:
 
With all that gobbly goop you come up with no surplus and thus an increase in debt and debt service. Keep spinning it as if it is even of value today. Obama is in office, this thread is about the opposition to Obama so explain to me why these numbers have lead to your support? Guess you are part of that upper 30's support for the empty suit in the WH. For someone so outraged over the Bush numbers you certainly are ignoring the Obama numbers. Says a lot about you

Obama economic results in 2011,
.4% GDP and 1.3% GDP growth in 2011(bea.gov)
25+ million unemployed or under employed Americans in 2011(bls.gov)
2.6 million fewer jobs(bls.gov)
4.2 trillion added to the debt in less than 3 years(U.S. Treasury Site)
Downgrade of the U.S. credit rating(S&P)
Rising Misery index 7.83 to 12.97 (The United States Misery Index By Year)
38-41% JAR and well over 50-55% disapproval ratings(Gallup)

Ha,ha, you keep repeating your same rhetoric. Look at Bush's spending - I posted in my previous post, then get back to me.
 
You sure have been trying to paint Obama as the big spender - so, you don't like it when Bush is accused of a recession, but at the same time you sure like to dump all of Bush's 2009 spending on Obama, because if you don't, then your previous post are lies.

Some Republicans, for instance, complain that Obama tripled the budget deficit in his first year. This assertion is understandable, since the deficit jumped from about $450 billion in 2008 to $1.4 trillion in 2009. As this chart illustrates, with the Bush years in green, it appears as if Obama's policies have led to an explosion of debt.
But there is one rather important detail that makes a big difference. The chart is based on the assumption that the current administration should be blamed for the 2009 fiscal year.
mitchell-122909-1.jpg


While this might make sense to a casual observer, it is largely untrue. The 2009 fiscal year began Oct. 1, 2008, nearly four months before Obama took office. The budget for the entire fiscal year was largely set in place while President Bush was in the White House.
So if we update the chart to show the Bush fiscal years in green, we can see that Obama is mostly right in claiming that he inherited a mess.
mitchell-122909-2.jpg

Some readers, particularly Republicans, are probably thinking I'm letting Obama off the hook too easily.
mitchell-122909-3.jpg


What about the so-called stimulus, they will ask, with its $787 billion price tag? Or the omnibus fiscal-year 2009 appropriations bill? And how about Cash for Clunkers and Obama's expansion of the children's health insurance program? Didn't these all boost spending in 2009?
The answer is yes. But these boondoggles amounted to just a tiny percentage of FY2009 spending — about $140 billion out of a $3.5 trillion budget — as the pie chart nearby illustrates.

Unbelievable and totally brainwashed. The 2009 budget was passed in 2008 under a Democrat Congress and was passed solely with Democrat Votes, FACT. Fact then that Obama took office in January and put Dept. heads in place that spent the budget yet you want to blame Bush? That is totally and complete bs and someone trying to save the Obama Presidency. Why do you still support this empty suit and why are you distorting his record?
 
Unbelievable and totally brainwashed. The 2009 budget was passed in 2008 under a Democrat Congress and was passed solely with Democrat Votes, FACT. Fact then that Obama took office in January and put Dept. heads in place that spent the budget yet you want to blame Bush? That is totally and complete bs and someone trying to save the Obama Presidency. Why do you still support this empty suit and why are you distorting his record?

1) cut
2) paste
3) get debunked
4) spiiiiiiiiiiiiiiiinnnnnnnn
5) make personal insult
 
1) cut
2) paste
3) get debunked
4) spiiiiiiiiiiiiiiiinnnnnnnn
5) make personal insult

2011 fiscal year deficit

The current deficit in the fiscal year of 2011 is $1,298 billion, which is higher by 0.33% than the $1,294.2 billion deficit recorded during the same time span in 2010.
 
Better tell that to the Commerce Dept who then screwed up their release. 2005 dollars mean nothing today, the numbers are what they are and affect both revenue and expenses.

Don't see Commerce Department using 2005 numbers

National Income and Product Accounts
Gross Domestic Product, 2nd quarter 2011 (third estimate)

Corporate Profits, 2nd quarter 2011 (revised estimate)

Real gross domestic product -- the output of goods and services produced by labor and property
located in the United States -- increased at an annual rate of 1.3 percent in the second quarter of 2011,
(that is, from the first quarter to the second quarter), according to the "third" estimate released by the
Bureau of Economic Analysis. In the first quarter, real GDP increased 0.4 percent.

It just means they aren't adjusted for inflation... it's not a huge deal but most people prefer to work in inflation adjusted dollars because they tell a better picture. And, again, it does not have to be 2005, it could be any year. You could use 1869 dollars if you wanted.

--------------------

You seemed to dismiss the idea that the previous president's budget does not end until Sept/Oct of the following year. Is that a fact you wish to dispute?

Also, if Bush allowed the misery rating to reach above 11% (which he did) does that make him a terrible president as well?
 
Last edited:
It just means they aren't adjusted for inflation... it's not a huge deal but most people prefer to work in inflation adjusted dollars because they tell a better picture. And, again, it does not have to be 2005, it could be any year. You could use 1869 dollars if you wanted.

Most people live and work in the present paying present expenses from current revenue.
 
Most people live and work in the present paying present expenses from current revenue.

Are you dense? You use inflation adjusted dollars so that you can compare other years. For instance, GDP in 2010 and 2011 could technically be the same, but due to inflation, 2011 would appear larger. If you don't adjust for inflation, you are missing a key element in comparing dollars per year. Inflation rates change per year, so if you compare 2011 dollars to 2010, and 2010 dollars to 2009 dollars, but you do not account for inflation, you will get an incorrect change in GDP.

It's simple really. Do you want me to do a little math tutorial for you? I'll do it if you want, I really don't mind.
 
Status
Not open for further replies.
Back
Top Bottom